Page History
...
Alpha diversity is a measure of the species diversity within a sample. Partek Flow can calculate two of the most commonly used alpha diversity metrics: Shannon index (1) & Simpson index (2). The Shannon index takes into account the number of different species (richness) and how evenly the counts are distributed among species (evenness). The more species you observe and more even their abundances are, the higher value of the Shannon index value, the higher the species diversity. in other words, the more diverse of the sample. The Simpson index gives more weight to common or dominant more abundant species, and less weight to rare species. It scales from 0 to 1. The closer to 1, the higher the species diversity.
...
- Click a Taxonomic data node
- Choose Alpha & beta diversity from the Metagenomic section of the toolbox
- (optional) If you wish to compare the alpha diversity values between groups of samples, choose the factors to set up the ANOVA. This can be helpful if you want to see if there is a significant difference in species diversity between predefined groups. This is optional, so you can skip this if you want.
- Click Finish
...
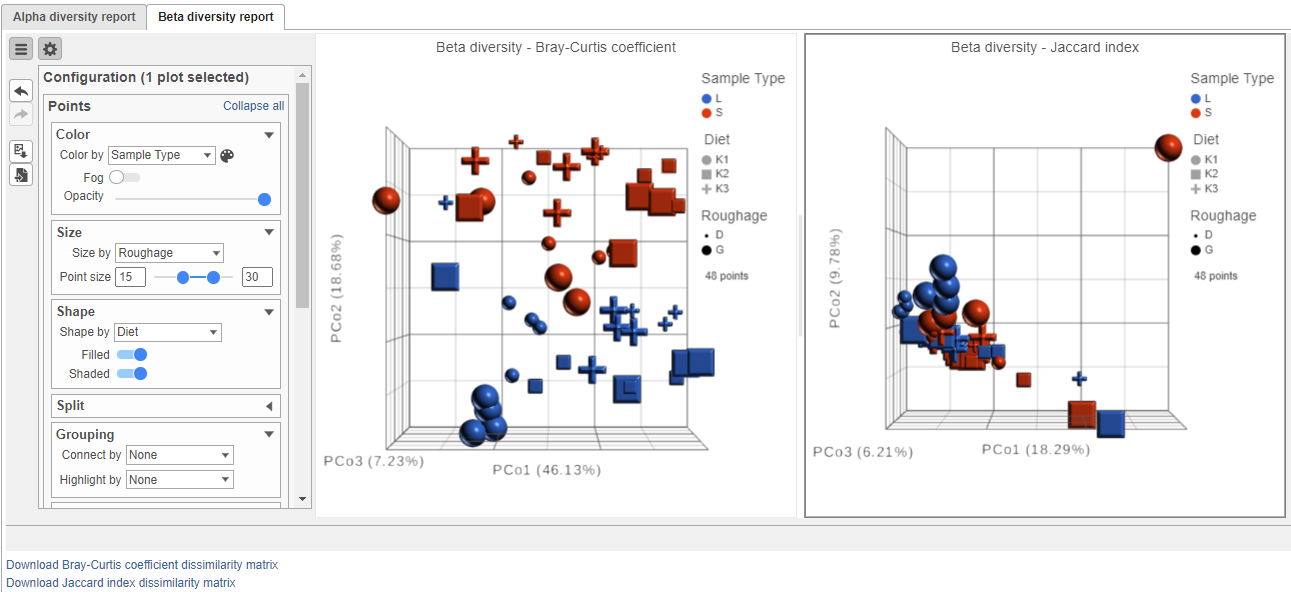
To obtain the table of pairwise comparisons (dissimilarity matrix) for each distance metric, click the appropriate hyperlink below the Data viewer. The table will be downloaded as a tab-delimited text file. For both distance metrics, the values range from 0 to 1. The higher the value, the more different that pair of samples are. The lower the value, the more similar they are.
| Numbered figure captions | ||||
|---|---|---|---|---|
| ||||
|
...
Overview
Content Tools