Page History
...
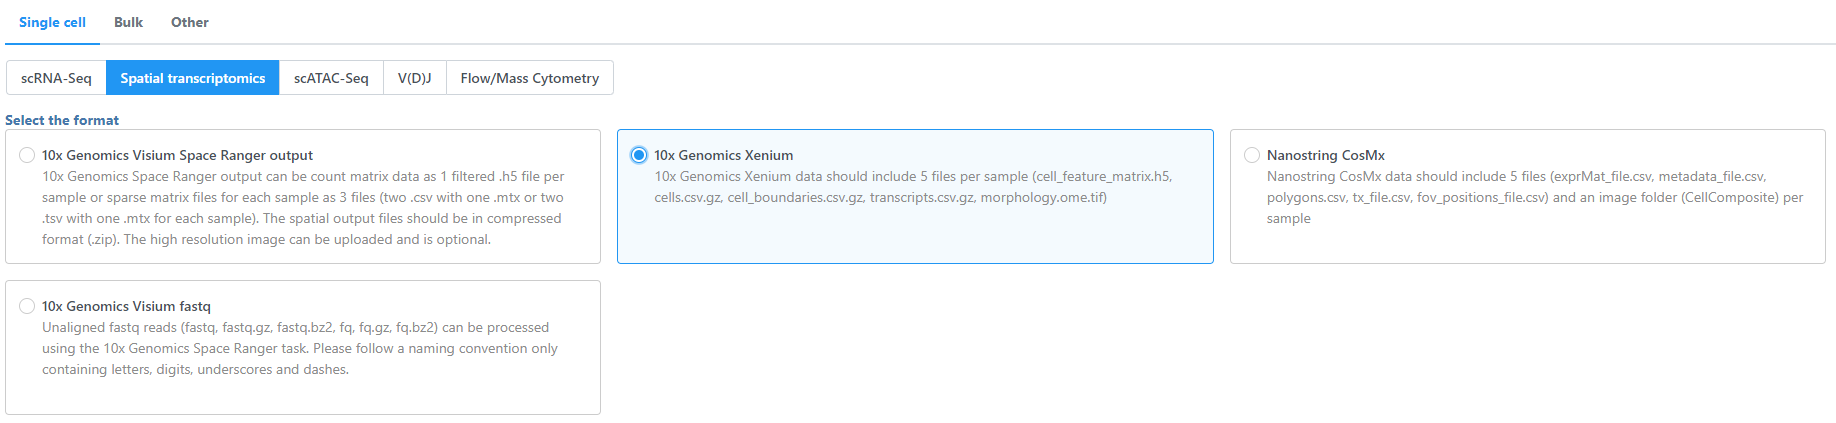
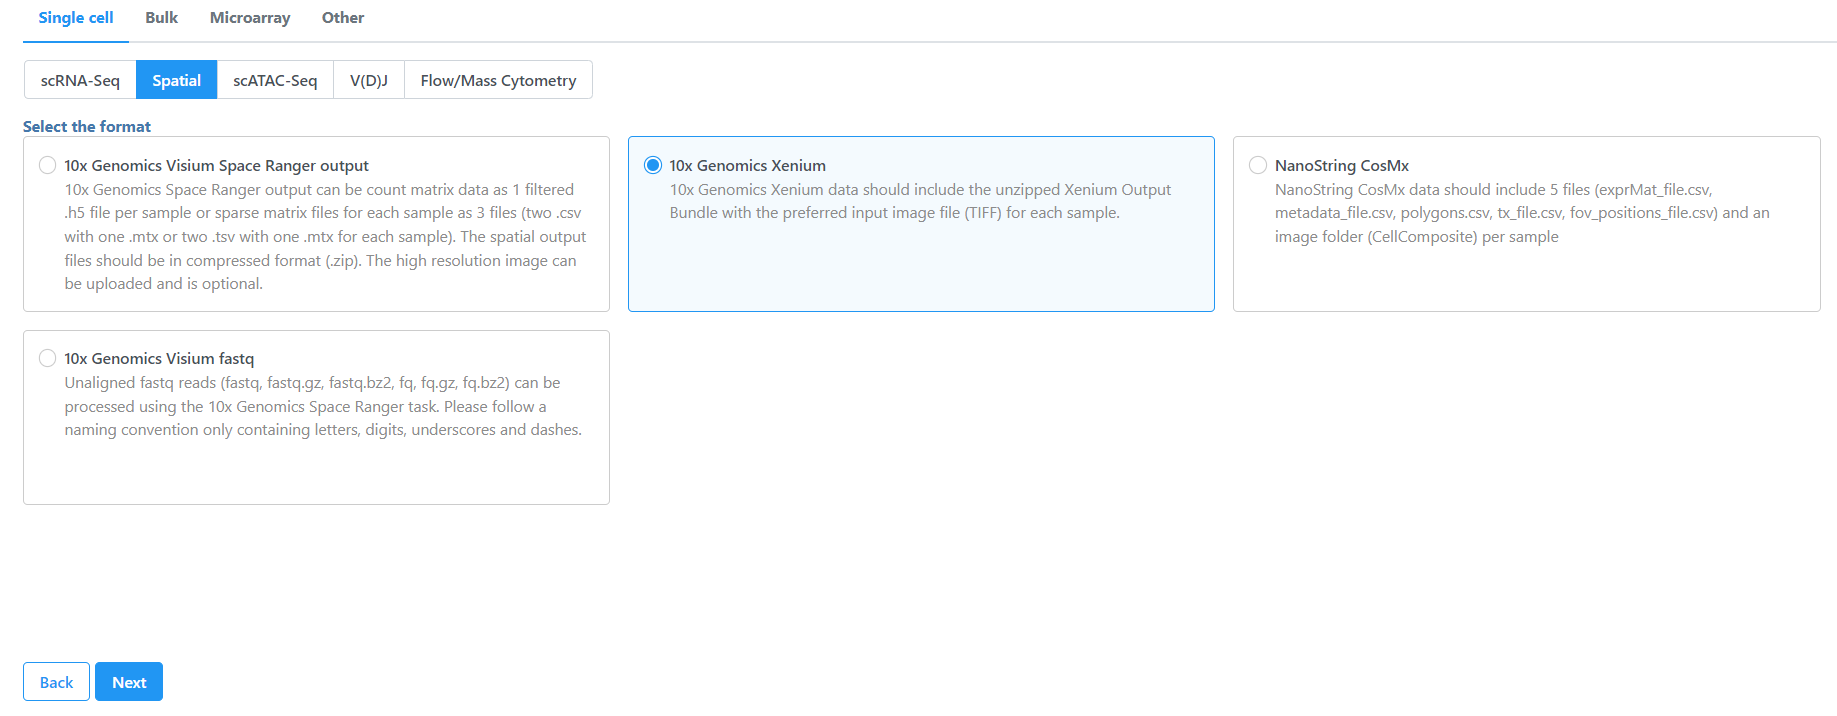
- Navigate the options to select 10x Genomics Xenium Output Bundle as the file format for input. Choose to import 10x Genomics Xenium for your project (Figure 2).
| Numbered figure captions | ||||
|---|---|---|---|---|
| ||||
|
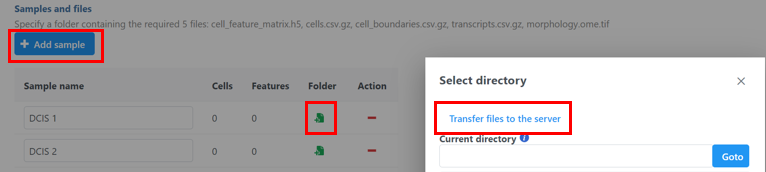
- Click Transfer files on the homepage, under settings, or during import.
- Click the blue + Add sample button
 then use the green Add sample folder to
  button to add each sample's Xenium output bundle folder (Figure 3).
...
- . If you have not already transferred the folder to the server, this can be done using Transfer files to the server
 (Figure 3).
| Numbered figure captions | ||||
|---|---|---|---|---|
| ||||
|

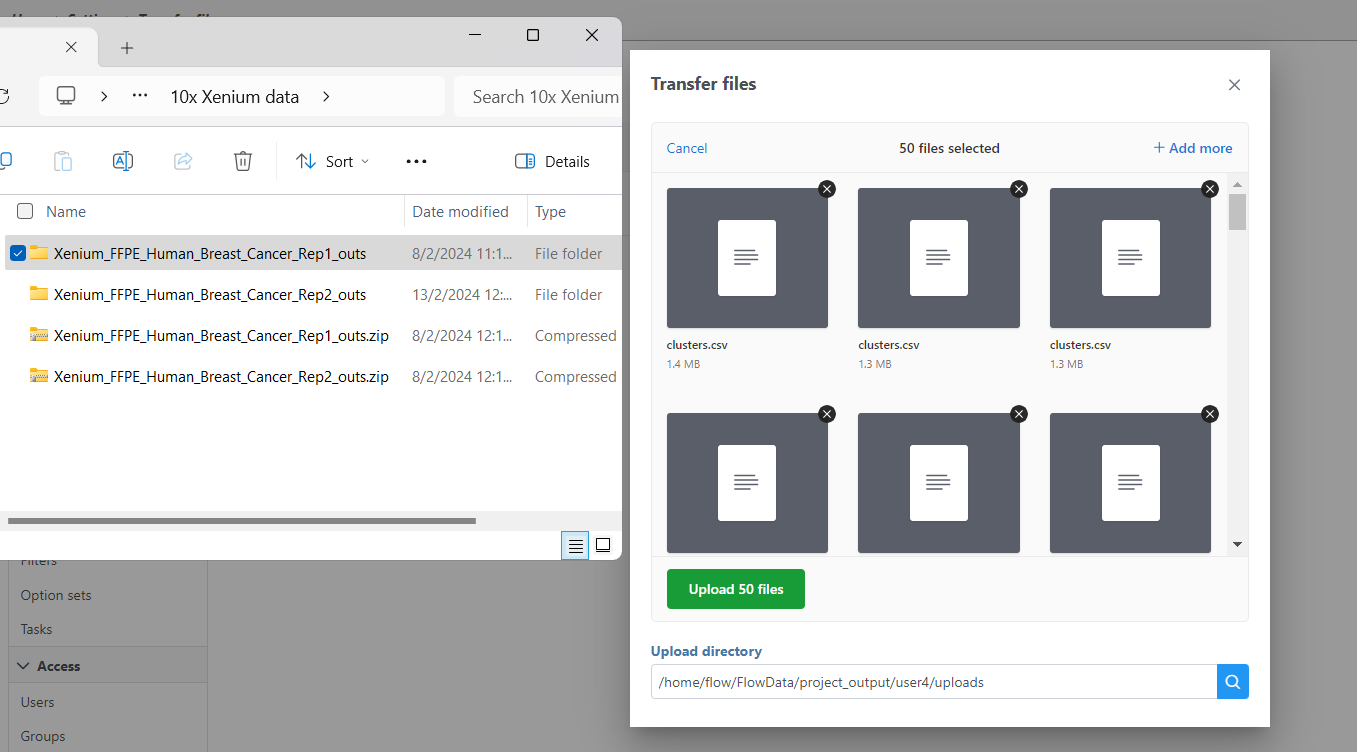
- Navigate to the appropriate files You will need to decompress the Xenium Output Bundle zip file before they are uploaded to the server. After decompression, you can drag and drop the entire folder into the Transfer files dialog, all individual files in the folder will be listed in the Transfer files dialog after drag & drop, with no folder structure (Figure 4). The folder structure will be restored after upload is completed.
| Numbered figure captions | ||||
|---|---|---|---|---|
| ||||
|
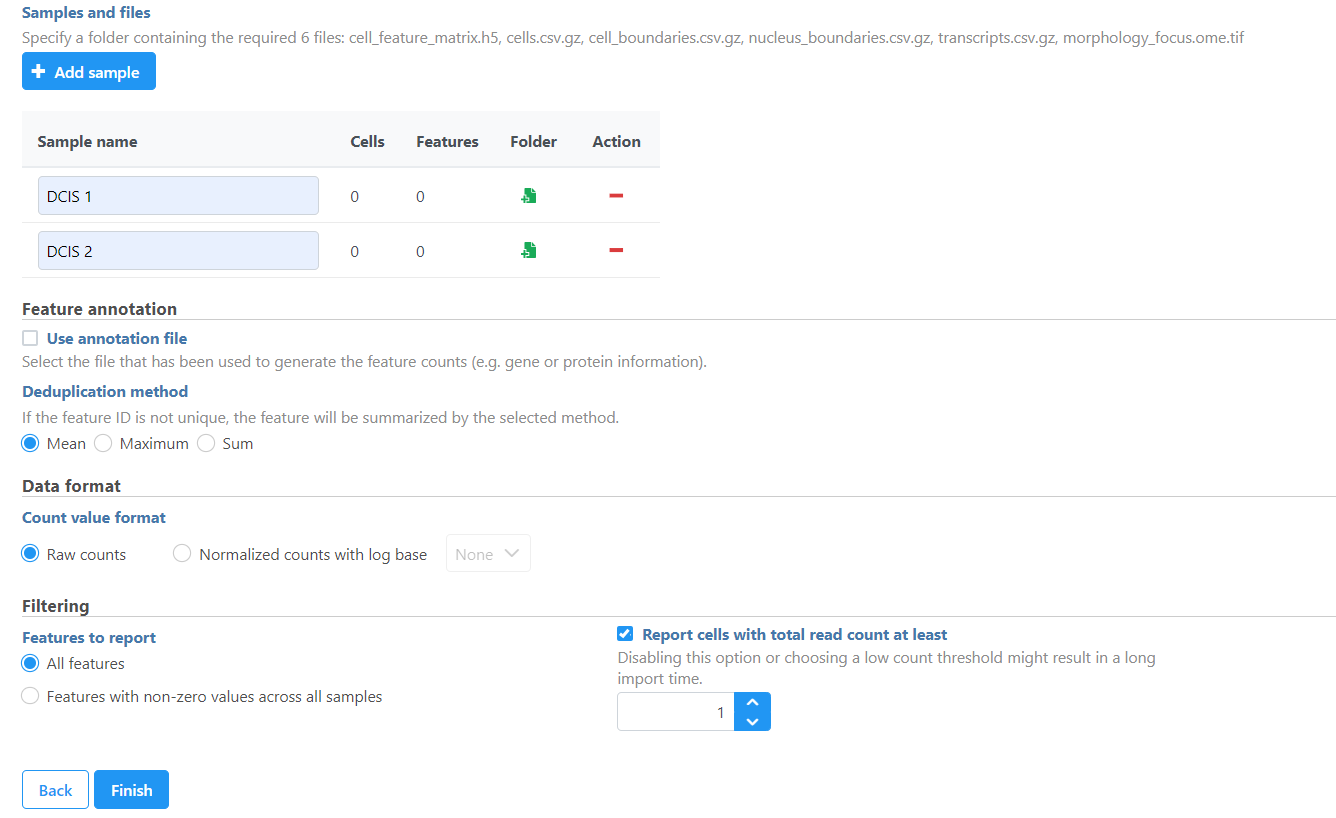
- Once uploaded the folder to the server, navigate to the appropriate folder for each sample using Browse Add sample
 (Figure 45).
The Xenium output bundle should be included for each sample (Figure 45). Each sample requires the whole sample folder or a folder containing these 5 6 files: cell_feature_matrix.h5, cells.csv.gz, cell_boundaries.csv.gz, nucleus_boundaries.csv.gz, transcripts.csv.gz, morphology_focus.ome.tif. Once added, the Cells and Features values will update. You can choose an annotation file during import that matches what was used to generate the feature count.
Do not limit cells with a total read count since Xenium data is targeted to less features.
| Numbered figure captions | ||||
|---|---|---|---|---|
| ||||
|

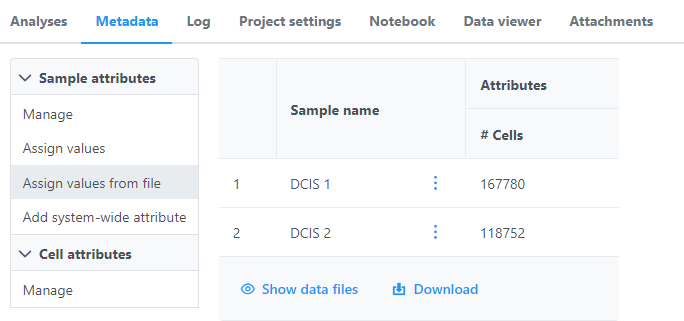
Once the download import completes, the sample table will appear in the Metadata tab, with one row per sample (Figure 56).
| Numbered figure captions | ||||
|---|---|---|---|---|
| ||||
|
...
Overview
Content Tools