Page History
...
The Genomic Segmentation task is divided into two steps. In the first step, each region is compared to an adjacent region to determine whether both have the same average copy number and whether a breakpoint can be inserted. This is determined by first using a two-sided t-test to compare the average intensities of adjacent regions and then checking whether the corresponding cut-off p-value is below the specified P-value threshold. The genomic size of a region is defined by the number of gneomic genomic markers in the region, Minimum genomic markers, while the magnitude of the significant difference between two regions is controlled by Signal to noise, which can be thought of as the difference in copy numbers between the regions. If the t-test is significant, ithe the copy number of the region differs significantly from its nearest neighbors. However, a second step is needed to detemine whether the difference is due to amplificaiton or deletion. In this second step, two one-sided t-tests are used to compare the mean copy number in the region with the expected diploid copy number. For a detailed explanation of the genomic segmenetation procedure, please consult our Genomic Segmentation white paper. For more detailed information about fine-tuning the parameters of your copy number analysis, please consult our guide, Optimizing Copy Number Segmentation.
The resulting spreadsheet, segmentation, shows one row per genomic region per sample (Figure 4). The columns provide the following information:
...
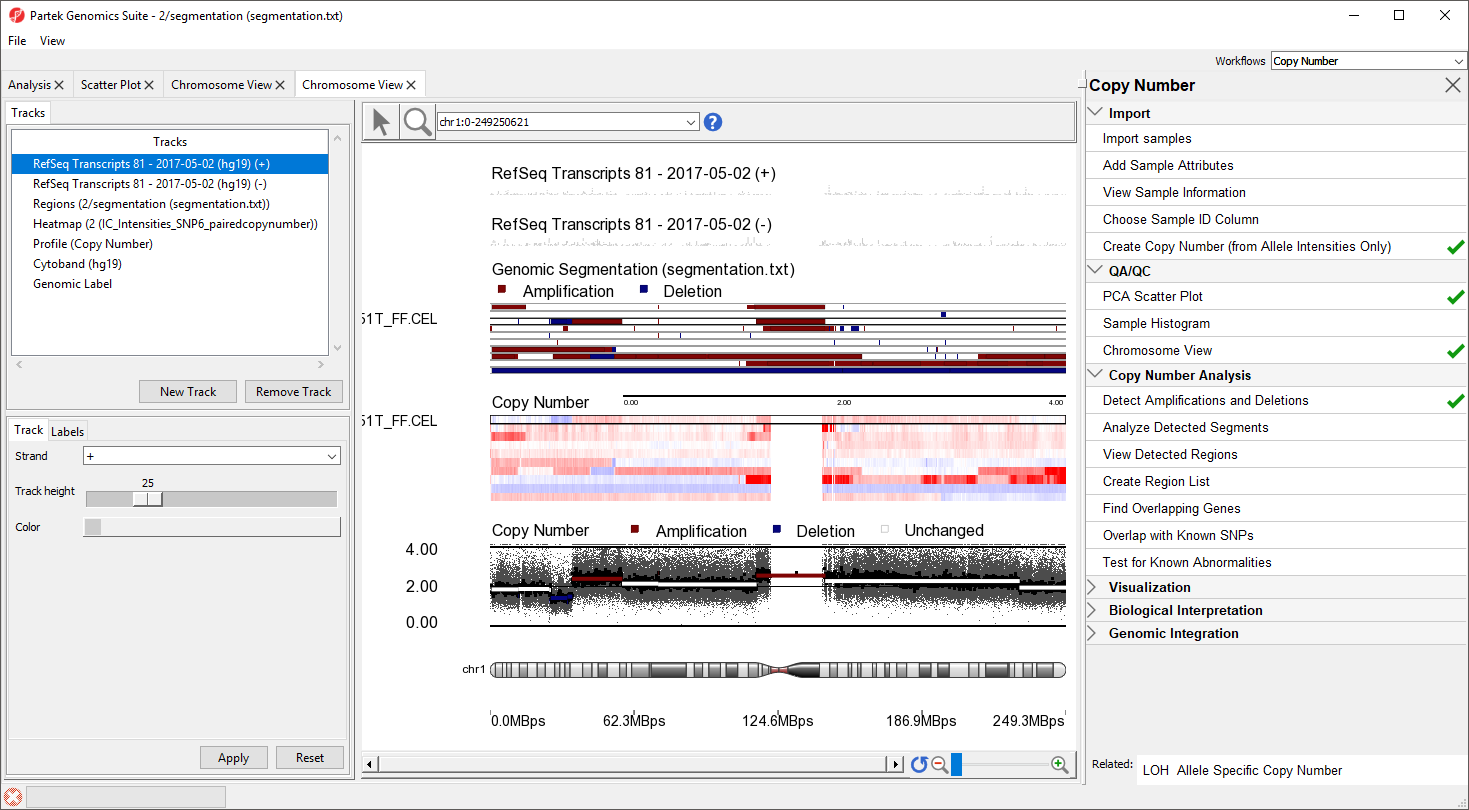
The Genomic Segementation track displays the segmentation results (Figure 5). Each line in the track represents a sample. Amplified, deleted, and unchanged regions are shown in red, blue, and white, respectively. The Profile track now also includes information from the segmentation spreadsheet ffor for the selected sample.
| Numbered figure captions | ||||
|---|---|---|---|---|
| ||||
|
...
Mousing over the chromosome will give cytoband information, mousing over the histogram will give the number of shared regions at each position and the numbe rof number of samples sharing the type of variation. Both the menu and display may be used to control which chromosomes are displayed; left-click in the menu to toggle a chromosome on/off and right click in the menu or graph to show only that chromosome.
...
Overview
Content Tools