Page History
What is Compare clusters?
Compare clusters is a tool to identify the optimal number of clusters for K-means clusteringClustering using the Davies-Bouldin index. The Davies-Bouldin index is a measure of cluster quality where a lower value indicates more optimal better clustering, i.e., the separation between points within the clusters is low (tight clusters) and separation between clusters is high (distinct clusters).
Running Compare clusters
We recommend normalizing your data prior to running Compare clusters, but the task will run on any counts data node.
- Click the counts data node
- Click the Exploratory analysis section of the toolbox
- Click Compare clusters
- Configure the parameters
- Click Finish to run (Figure 1)
| Numbered figure captions | ||||
|---|---|---|---|---|
| ||||
|
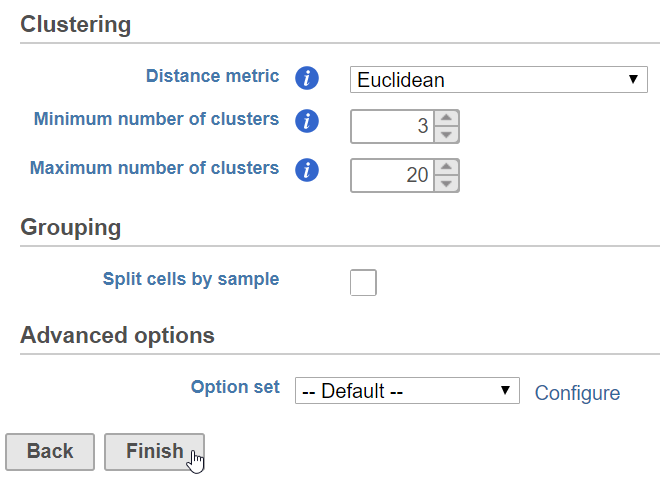
The parameters for Compare clusters are the same as for K-means clustering, but must consider a range of cluster numbers, not a single number of clusters.
Compare clusters task report
The Compare clusters task report is an interactive line chart with the number of clusters on the x-axis and the Davies–Bouldin the Davies-Bouldin index on the y-axis (Figure 2).
...
- Click a point on the plot to select it or type the number of clusters in the text box Partition data into clusters
Selecting a point sets it as the number of clusters to partition the data into. The number of clusters with the lowest Davies-Bouldin index value is chosen by default.
- Click Generate clusters to run K-means clustering with the selected number of clusters
This generates a A K-means clustering task node and a Clustering result data node . are produced. Please see our documentation on K-means Clustering for more details.
| Additional assistance |
|---|
| Rate Macro | ||
|---|---|---|
|
...
Overview
Content Tools