Page History
Table of Contents maxLevel 2 minLevel 2 exclude Additional Assistance
Importing a region list
A region list in PGS must contain the chromosome, start location, and stop locations as the first three columns, respectively. The chromosome name (or number ) in the region list must be compatible with the genomic annotation for the species if you plan to use any feature (like motif detection) that requires reference sequence information.
- Import the region list as described above for text files . with the following options
- Select Other for data type
- Set chromosome as a text field
- Set location start and stop
- as either integer or
- text fields
- Right-click on the imported spreadsheet in the spreadsheet tree
- Select Properties
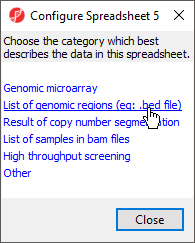
- Select List of genomic regions from the Configure Spreadsheet dialog
- Select region in the Add Property drop-down menu and select Add
- to add region to the properties (Figure 1)
| Numbered figure captions | ||||
|---|---|---|---|---|
| ||||
|
The spreadsheet properties will now include region. Alternatively, region can be added as a spreadsheet property from the Configure Genomic Properties dialog by selecting Advanced.. , choosing region from the drop-down menu, selecting Add, and selecting OK.
If you would like to do any operation that requires looking up hte the reference genomic sequence information for the regions based on genomic location, you will need to specify the species for this region list.
- Right-click on the imported spreadsheet in the spreadsheet tree
- Select Properties
- Select Genomicspecies from the Add Property drop-down menu Select and click Add
- Select your options from the Species and Genome Guild drop Specify the Species Name and Genome Build from the drop-down menus
- Select OK
With a few additional options, the region list can be made viewable in the genome browser.
- Right-click on the imported spreadsheet in the spreadsheet tree
- Select Properties
- Select Advanced..
- Select Edit next to the species name
- Specify the Cytoband file and 2Bit sequence file
- Select OK
Motif detection
Starting with a region list, you may detect either known or de novo motifs using the ChIP-Seq
Seq workflow if your spreadsheet has been associated with a species and a reference genome as
described in the import section.
- Select ChIP-Seq from the Workflows drop-down menu
- Select Motif detection from the Peak Analysis section of the workflow
Both options ( Discover de novo motifs and Search for known motifs) can now can be performed. Motifs (de novo) may be displayed in the Genome Browser and known detected motifs may be viewed in web-log format by right-clicking on a header row of the motif spreadsheet.Motif detection sequence information of the genome, you can specify either .2bit file or .fa file which can be used to create .2bit file
Determining the average values for a region list
If you have a region list or a bed .BED file and you have a microarray experiment with data, you can summarize the microarray data according to by the genomic coordinates contained in the region list. For instanceexample, the region list contains a list of CpG islands, the experiment contains methylation percentage values for probes (β values), and you would like to summarize the methylation values for individual probes for the CpG islands. Or you have a list of copy number amplifications, microarray gene expression data, and you are interested in determining if the average intensities of the probes in those regions is higher than expected.
...
Import the region list (or BED file) and specify the region property as explained elsewhere in this document
...
of all probes in each CpG island.
- Import the region list (or .BED file)
Be sure that you have added the region property. The list of region coordinates (chromosome, start, stop) from the region list will be mapped against the reference genome specified for the microarray data so specifying Species and Genome Build for your region list is unnecessary.
- Open the microarray data spreadsheet, this spreadsheet should have annotation file associated to, and there are genomic location information in the annotation file.
Samples should be on rows and data on columns in the microarray data spreadsheet.
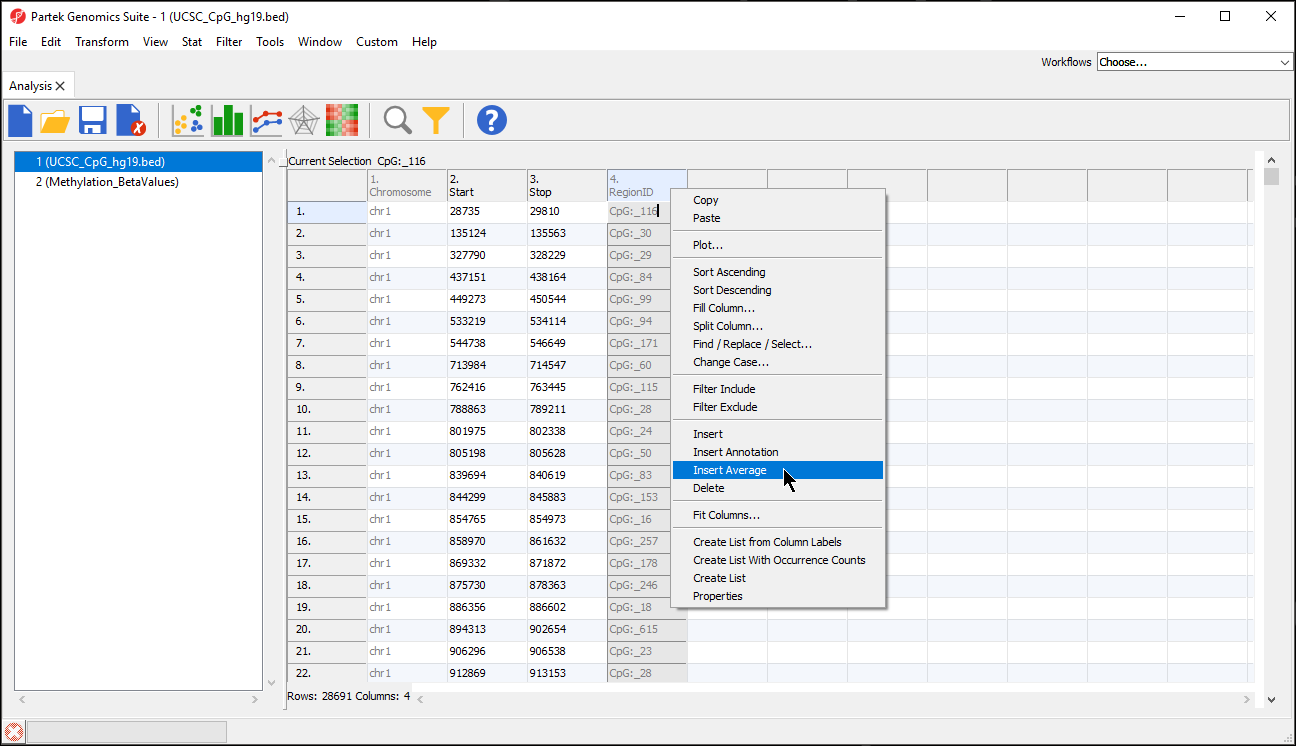
- Select the region list spreadsheet
- Right-click any column header in the region list spreadsheet
- Select Insert Average from the pop-up menu (Figure 2)
| Numbered figure captions | ||||
|---|---|---|---|---|
| ||||
|
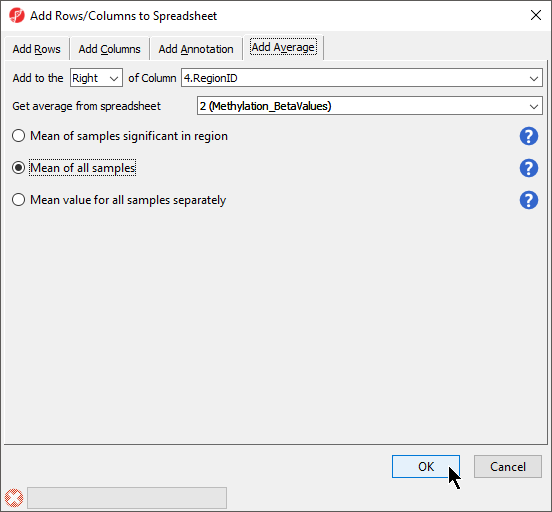
- Select the microarray data spreadsheet containing the values you want to average for each region from the Get average from spreadsheet drop-down menu
There are three options for averaging the data (Figure 3). Mean of samples significant in region is used when the region list has SampleIDs from the microarray data set associated with each region. In this case,
...
Find region overlaps
You have a list of regions from another analysis program (perhaps you detected peaks using an R program) and you’d like to compare that region list with a region list that Genomics Suite calculated. Perhaps you have two lists created by Genomics Suite (one generated from peak detection with one set of parameters and the other created with different parameters) and you’d like to see what the two lists have in common. You may use the Tools > Find Region Overlaps command to compare two or more region lists as shown.
There are two separate modes of operation for this command: Report all regions and Only report regions present in all list. The first option, Report all regions, will report all regions in both lists. If there is any region overlap between the lists, the intersection of the regions will be reported along with the only the microarray data set samples specified for each region would be included in the mean calculation. Mean of all samples will add columns for the mean value of all probes for all samples and the number of probes for all samples in each region. Mean value for all samples separately will add two columns for each sample with the mean value of all probes for that sample and the number of probes for that sample in each region.
- We have selected Mean value for all samples
- Select OK (Figure 3)
| Numbered figure captions | ||||
|---|---|---|---|---|
| ||||
|
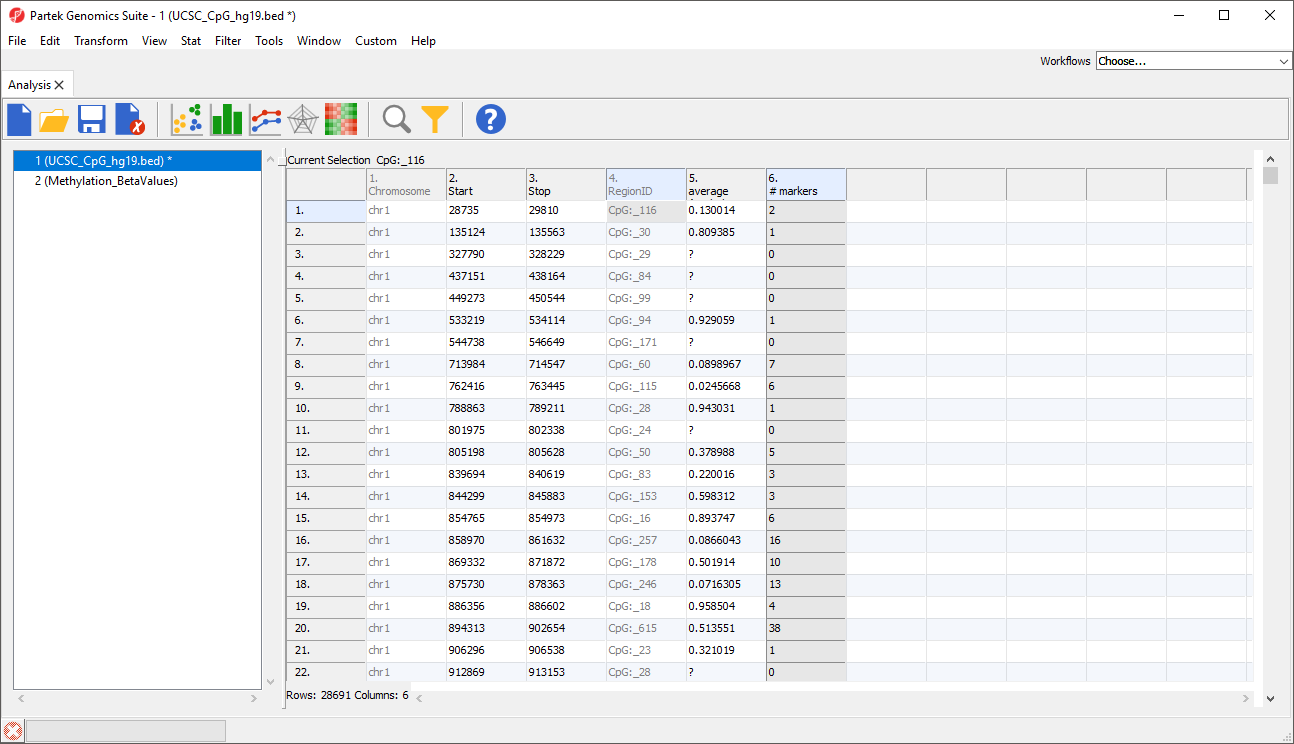
Columns will be added to the regions list spreadsheet. Here, we have added two columns with the average β-value for all samples in each CpG island and the number of probes in each CpG island (Figure 4).
| Numbered figure captions | ||||
|---|---|---|---|---|
| ||||
|
Find region overlaps
If you have two or more region lists with coordinates on the same reference genome, you can compare them to identify overlapping regions.
- Open all region list spreadsheets that you want to compare
- Select Tools from the main toolbar
- Select Find Region Overlaps (Figure 5)
| Numbered figure captions | ||||
|---|---|---|---|---|
| ||||
|
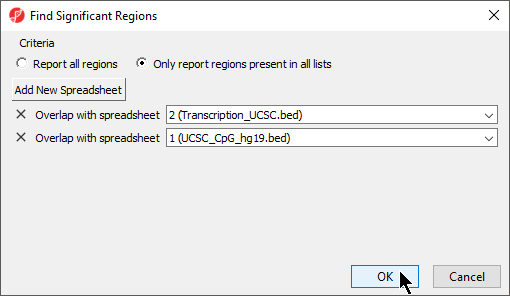
The Find Region Overlaps tool has two modes of operation. The first, Report all regions, creates a new spreadsheet with any regions that did not intersect and all regions of intersection between any of the input lists. For each intersection, the start and stop coordinates of the intersection , and the percent overlap between the intersected region with each of the regions in the input lists . If a region is found in only one list, it will be reported as well.In contrast, the second option, are reported. The second, Only report regions present in all lists, will intersect both lists and only reports creates a new spreadsheet with the intersected regions found in all the lists.
Importing genomic locations to be used with annotating SNVs
...
- Select your preferred mode; we have selected Only report regions present in all lists
- Select Add New Spreadsheet to add any spreadsheets you want to compare; we are comparing two region list spreadsheets (Figure 6)
- Select OK
| Numbered figure captions | ||||
|---|---|---|---|---|
| ||||
|
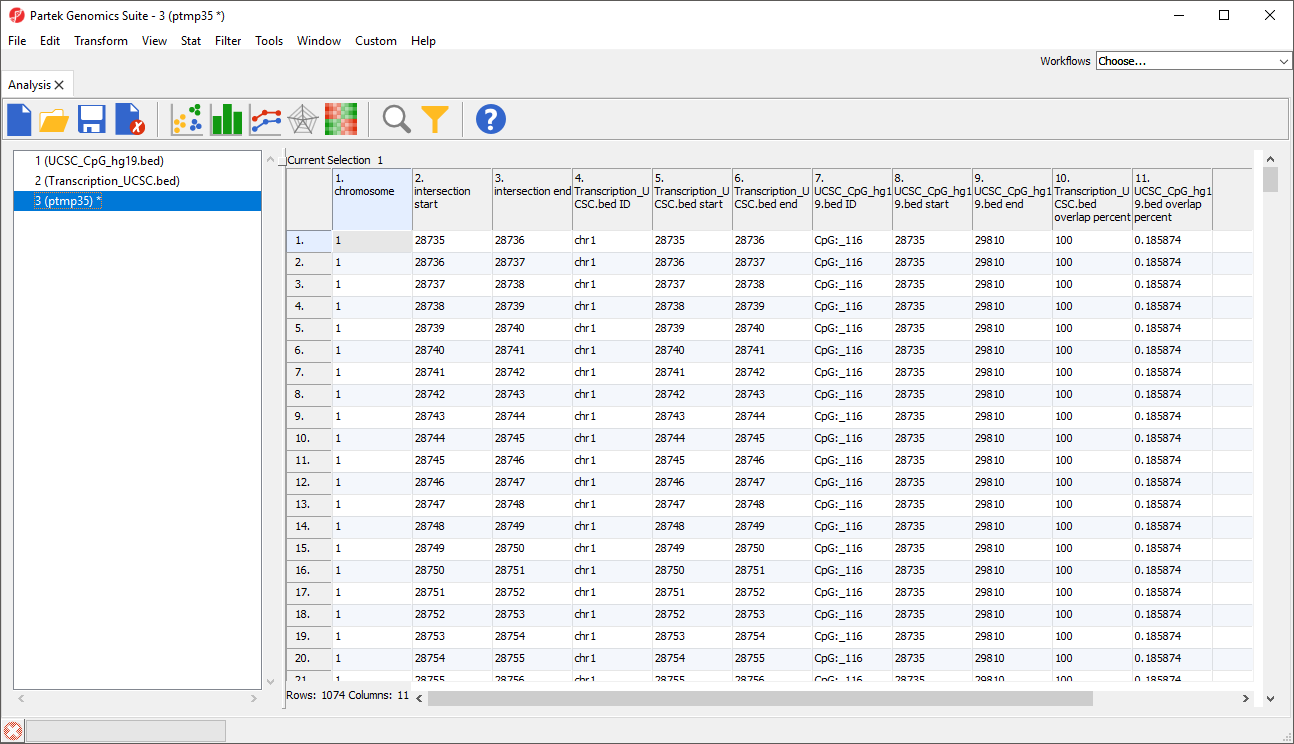
A new region list spreadsheet will be created (Figure 7). The new region list is a temporary spreadsheet so be sure to save it if you want to keep it.
| Numbered figure captions | ||||
|---|---|---|---|---|
| ||||
|
Importing a genomic position list for SNV annotation
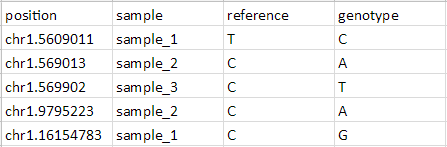
To be annotated using the Annotate SNVs tool, an imported SNV position list must have four columns per locus:
- Position of the SNP listed as chr.basePosition
- Sample ID or name
- The reference base
- The SNP call (sample genotype base)
- Prepare input list as shown in Figure 20 and save (Figure 8) with four columns describing the position, sample, reference base, and sample genotype base for each SNV
| Numbered figure captions | ||||
|---|---|---|---|---|
| ||||
|
Save as either a tab-separated or comma separatedseparated filefile
Use File > Import > Text to import the table. During import, change the data type of column 1 (as in Figure 3) to text by right-clicking on the color bar of column one and changing the data type to text. You may leave the other columns as categorical response types
The correct properties must be set for this spreadsheet. Right-click on the newly imported spreadsheet in the navigator and select Properties
- Choose Other in the Configure Spreadsheet dialog (Figure 6)
- Make sure Genomic is selected in the Add Property pull-down menu and select Add In the next dialog box, select Genomic location instead of marker IDs in the Choose the type of genomic data. The Marker ID in column should be set to the first column. [If Marker ID in column does not contain any items in the pull-down list, it is likely that the first column was not a text column (drawn in gray) during import. If this happens, then right-click in the column header in the spreadsheet and change Type: to text.]
Specify the Species from a pull-down menu selection or by typing in the species name. Select Edit Genome to specify the Species Name, Genome Version, Cytoband file, and 2Bit sequence file. The last two fields are optional. Select OK
Now that the properties have been set appropriately, Tools > Annotate SNVs may be invoked on this
spreadsheet.
the table as a text file
Select Genomic data for What type of data is this file?
Set the position column Type to text
Set the other columns Type to categorical
Select Genomic location instead of marker IDs from the Choose the type of genomic data drop-down menu of the Configure Genomic Properties dialog
Specify the Species and Genome Build
Select OK
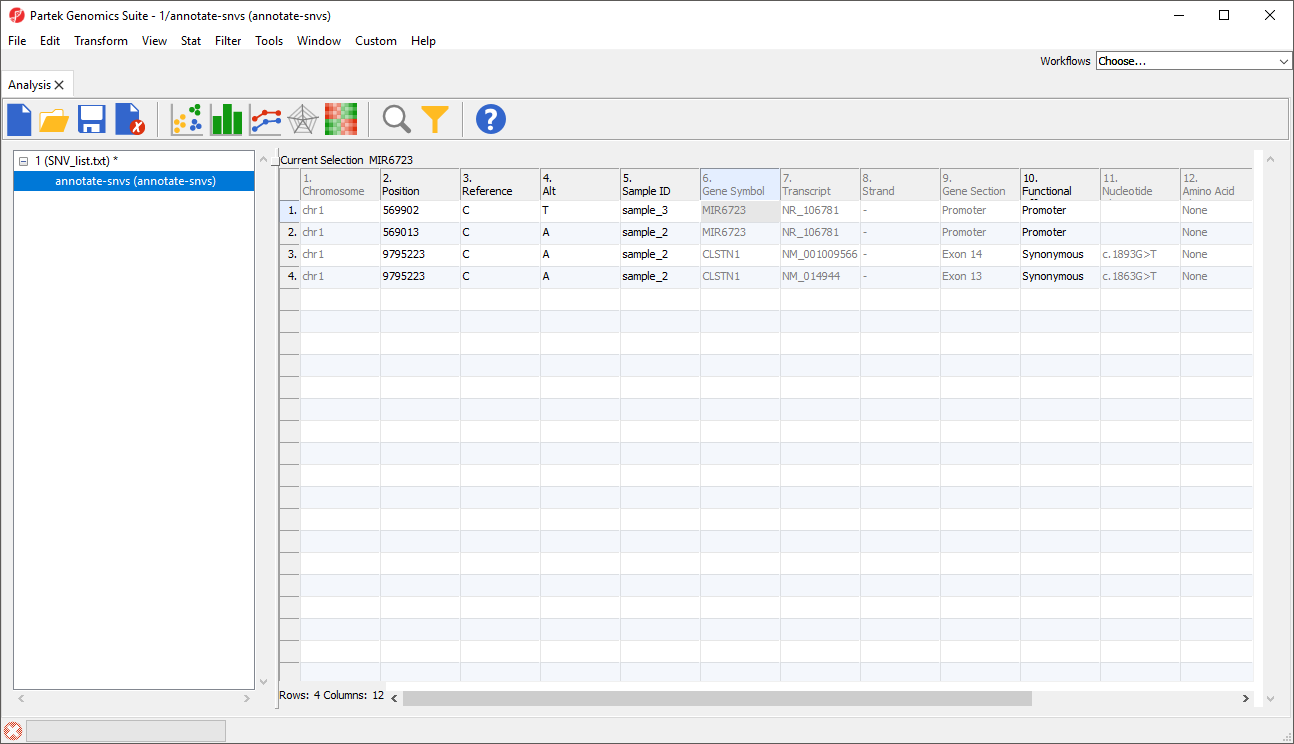
The Annotate SNVs tool can now be invoked on this spreadsheet to generate an annotation spreadsheet (Figure 9).
| Numbered figure captions | ||||
|---|---|---|---|---|
| ||||
|
| Page Turner | ||
|---|---|---|
|
...
Overview
Content Tools