Page History
...
There are many useful visualizations, annotations, and biological interpretations interpretation tools that can operate on a gene list. In order for these features operate on work with an imported list, an annotation file must first be associated with the gene - list. Additionally, many operations that work with a list of significant genes (like GO- or Pathway-Enrichment) require comparison against a background of “non-significant” genes.
Adding an annotation file
The The quickest way to accomplish both is to use the background of “all genes” for that organism provided by an annotation source like RefSeq, Ensembl, etc. in .pannot (Partek® annotationPartek annotation), .gff, .gtf, .bed, tab- or comma-delimited format. If the file is not already in a tab-separated or comma delimited format, you may import, modify, and save the file in the proper file format.
Associating a spreadsheet with an annotation file
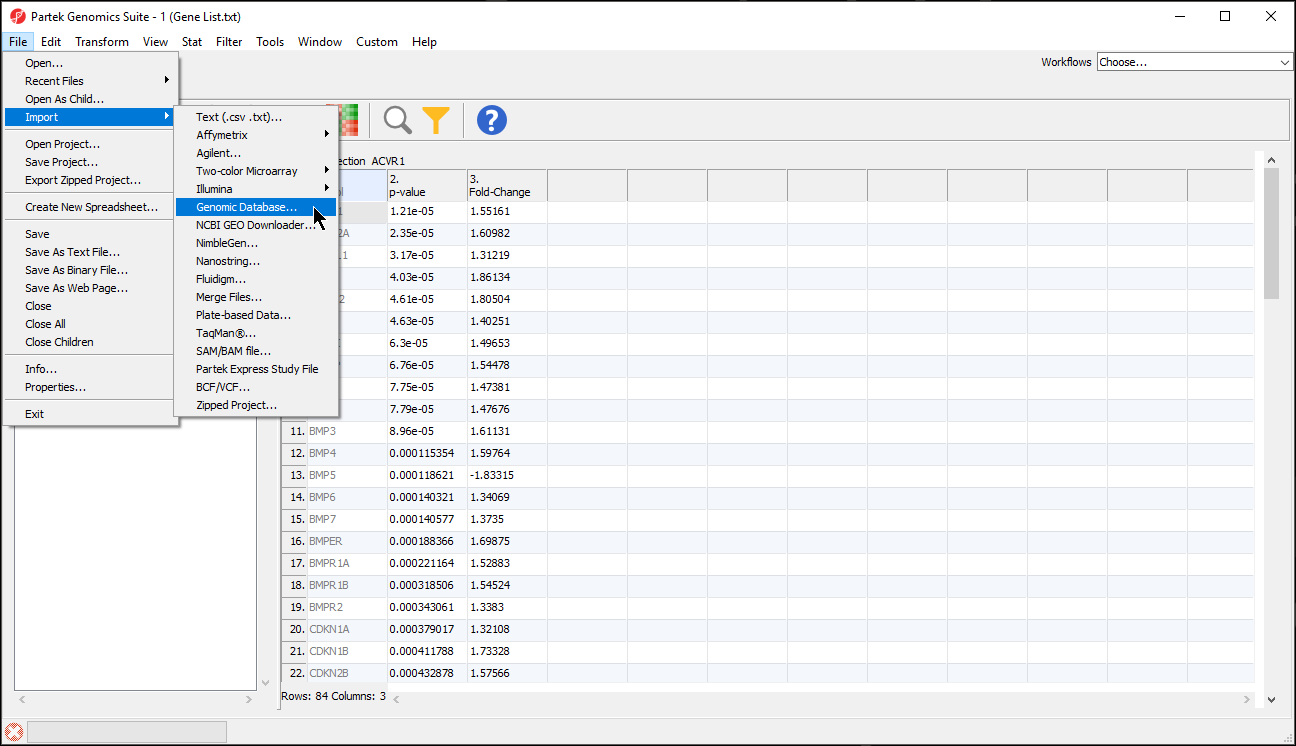
- Select File from the main toolbar
- Select Genomic Database under ImportImport (Figure 1)
| Numbered figure captions | ||||
|---|---|---|---|---|
| ||||
|
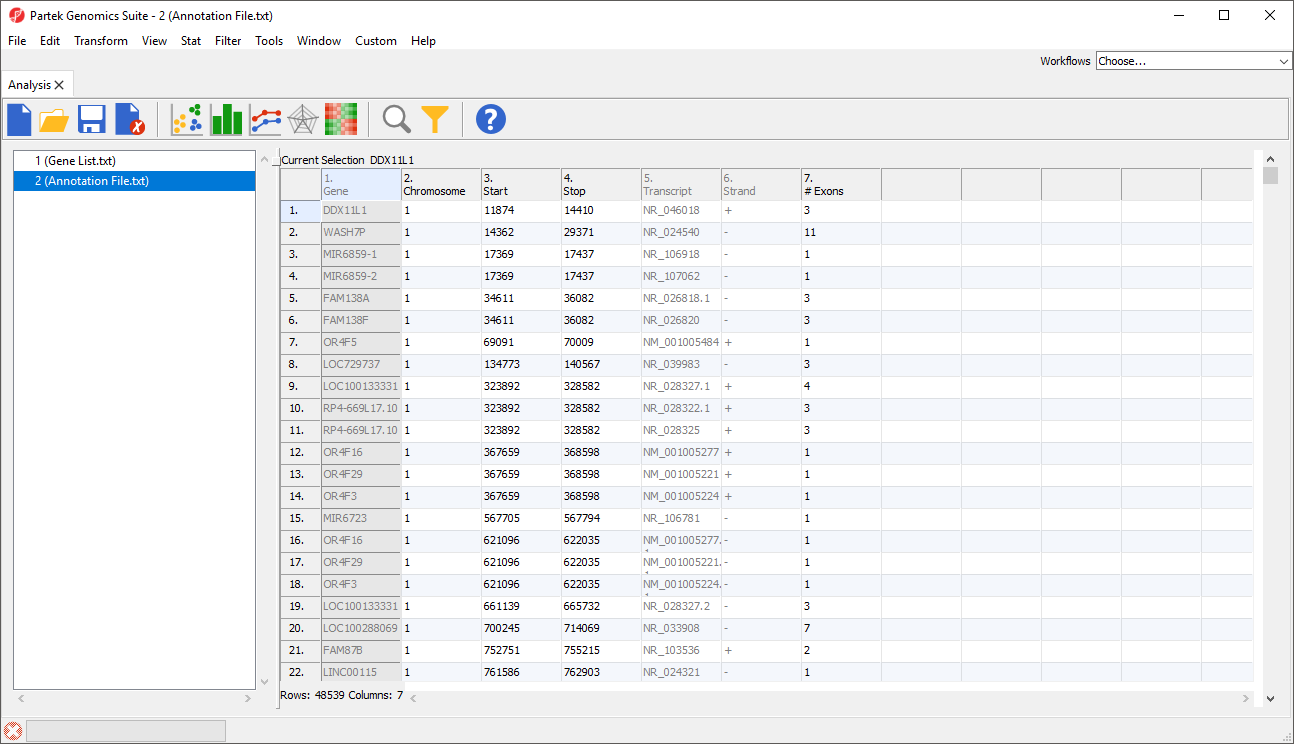
- Select the annotation file; we have selected in this example, we select a .pannot file downloaded from Partek distributed library file repository – hg19_refseq_14_01_03_v2.pannot from the C:/Microarry Libraries folder
- Delete or rearrange the columns as necessary; we have placed the column with identifiers (should be unique ID) that correspond to our gene list first
- Select (
 ) Select File then Save As Text File... to save the annotation file; we have named it Annotation File (Figure 2)
| Numbered figure captions | ||||
|---|---|---|---|---|
| ||||
 |
- Select (
 ) to close the annotation file
Now we can add the annotation file to our imported gene list.
- Right click 1 (Gene Listgene_list.txt) in the spreadsheet tree
- Select Properties from the pop-up menu
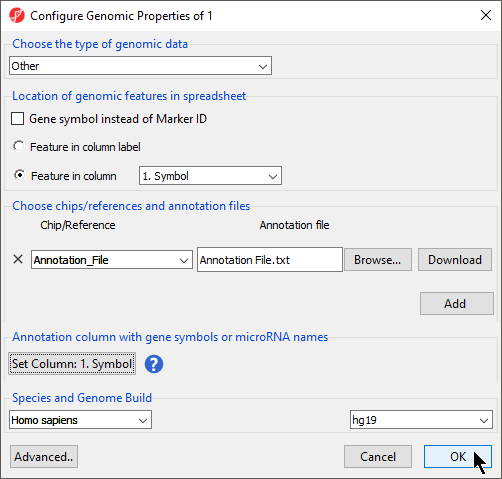
This is brings up the Configure Genomic Properties dialog we saw earlier (Figure 63).
| Numbered figure captions | ||||
|---|---|---|---|---|
| ||||
|
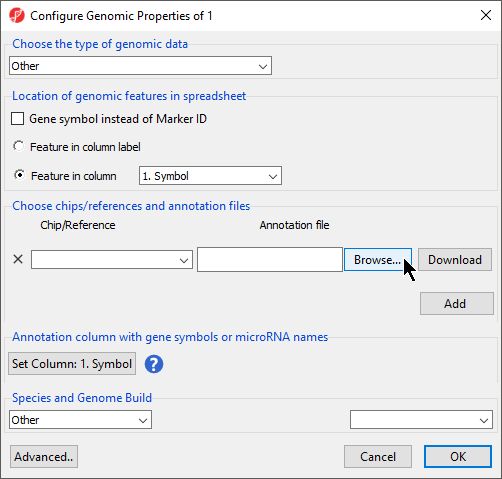
- Select Browse under Annotation File
- Choose the annotation file; we have chosen Annotation File.txt
- Select appropriate species and genome build options; we have selected Homo sapiens and hg19
- Select OK
Adding annotations
Inserting annotations from an annotation file
If a genomic annotation file has been added, annotations from the file can be added as columns in the spreadsheet.
- Right click on a column header
- Select Insert Annotation
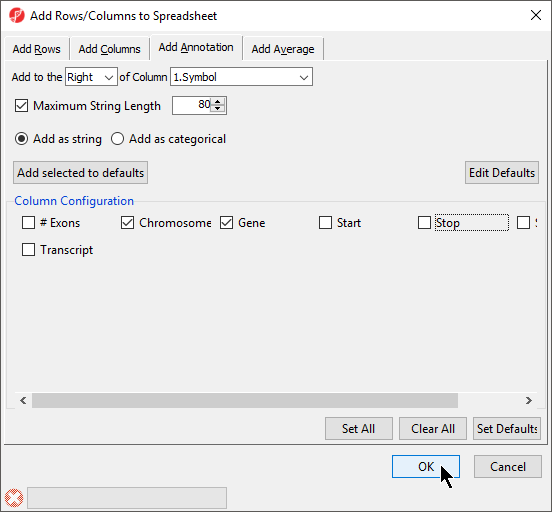
- Select columns to add from Column Configuration (Figure 8)
- Select OK
txt
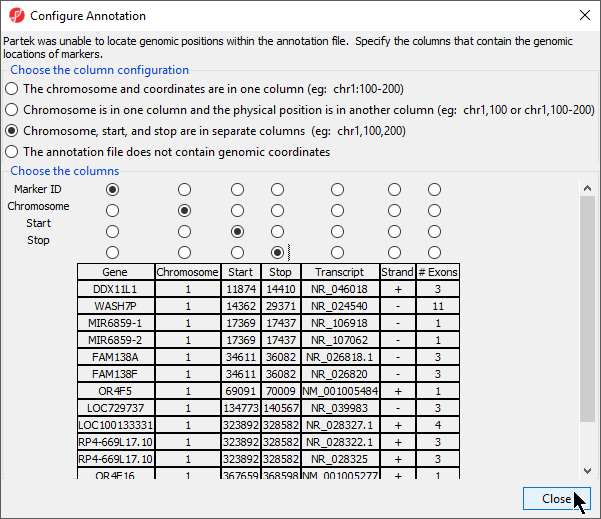
If this is the first time you have used an annotation, the Configure Annotation dialog will launch. This is used to choose the columns with the chromosome number and position information for each feature. Our example annotation file has chromosome, start, and stop in separate columns.
- Select the proper column configuration options (Figure 4)
| Numbered figure captions | ||||
|---|---|---|---|---|
| ||||
|
Annotating with cytobands
- Select Annotate with Cytobands from Tools in the main toolbar when a suitable spreadsheet is open
A column with cytoband locations will be added to the spreadsheet. Adding a cytoband is possible if genomic coordinates are associated with the gene list spreadsheet during import or by association with an annotation file.
Annotating with known SNPs
- Select Annotate with Known SNPs from Tools in the main toolbar when a suitable spreadsheet is open will add
...
|
- Select Close to return to the Configure Genomic Properties dialog
- Select Set Column: to open the Choose column with gene symbols or microRNA names dialog (Figure 5)
| Numbered figure captions | ||||
|---|---|---|---|---|
| ||||
|
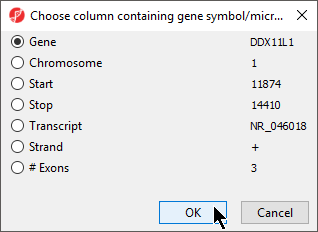
- Select the appropriate column; here the default choice of 1. Symbol is appropriate
- Select OK to return to the Configure Genomic Properties dialog
- Select the appropriate species and genome build options; we have selected Homo sapiens and hg19 (Figure 6)
| Numbered figure captions | ||||
|---|---|---|---|---|
| ||||
|

Alternatively, to generate a list of SNP IDs per row, right-click on a row header and select Create list of dbSNP.
In addition to SNPs, this feature can associate any data with a list of genes or genomic coordinates; the dbSNP database, any miRNA database, data from the Database of Genomic Variants (dgv), any mRNA transcriptome database, or any custom annotation source can be associated with your list. In each case, this feature will add columns to the imported gene list spreadsheet that match the genes with features from those databases.
GO Enrichment
The Gene Ontology (GO) Enrichment p-value calculation uses either a Chi-Square or Fisher’s Exact test to compare the genes included in the significant gene list to all possible genes present in the experiment or the background genes. For a microarray experiment, background genes consists of all genes on the chip/array; for a next generation sequencing experiment, all genes in the species transcriptome are considered background genes.
Because the calculation is essentially comparing overlapping sets of genes and does not use intensity values, GO Enrichment can be performed on an imported gene list. GO Enrichment is available through the Gene Expression workflow.
If no annotation file has been specified for the gene list, GO Enrichment will use the full species transcriptome as the background genes. While suitable for next generation sequencing experiments, for microarray experiments, only the genes on the chip/array are appropriate. Please contact our technical support department for assistance with this step if needed.
Pathway Enrichment
Like GO Enrichment, Pathway Enrichment does not require numerical values, but instead operates on lists of genes - a list of significant genes vs. background genes. Consequently, Pathway Enrichment may be used with an imported list of genes. The list of background genes is set to the species transcriptome by default, but can be set to a specific set of genes if the gene list has been associated with an annotation file.
| |||
|
- Select OK
- Select () to save the spreadsheet
The annotation file has been associated with the spreadsheet and additional tasks can now be performed on the data, e.g. since the annotation has genomic location, you can draw chromosome view on this data.
Adding annotations to a spreadsheet
Inserting annotations from an annotation file
If an annotation file has been associated with a spreadsheet, annotations from the file can be added as columns in the spreadsheet when each identifier is on a row.
- Right click on a column header
- Select Insert Annotation
- Select columns to add from Column Configuration; we have selected Chromosome, Start, and Stop (Figure 7)
- Select OK
| Numbered figure captions | ||||
|---|---|---|---|---|
| ||||
|
| Page Turner | ||
|---|---|---|
|
| Additional assistance |
|---|
| Rate Macro | ||
|---|---|---|
|
...
Overview
Content Tools