Page History
Section Heading
Section headings should use level 2 heading, while the content of the section should use paragraph (which is the default). You can choose the style in the first dropdown in toolbar.
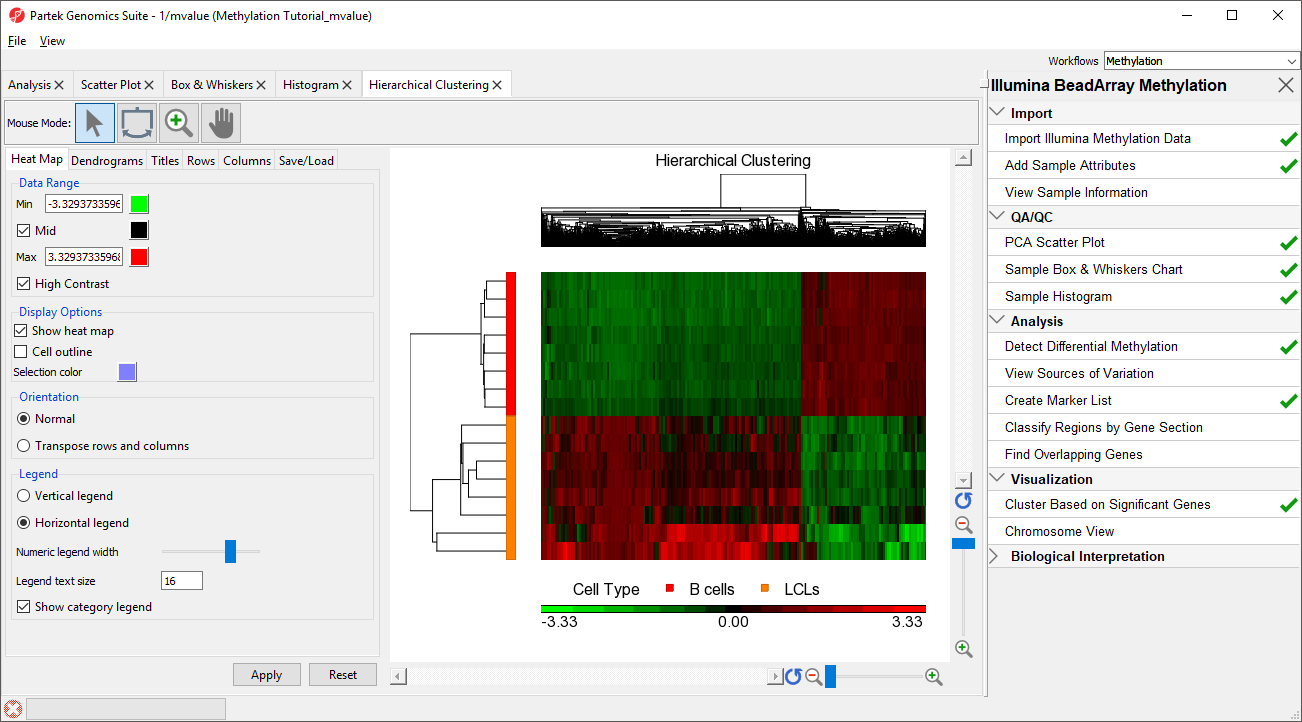
The significant CpG loci detected in the previous step actually form a methylation signature that differentiates between LCLs and B cells. We can build and visualize this methylation signature using clustering and a heat map.
- Select the LCLs_vs_Bcells_CpG_Islands spreadsheet in the spreadsheet pane on the left
- Select Cluster Based on Significant Genes from the Visualization panel of the Illumina BeadArray Methylation workflow
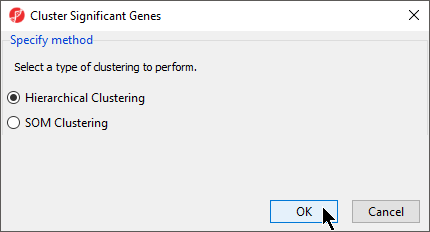
- Select Hierarchical Clustering for Specify Method (Figure 1)
| Numbered figure captions | ||||
|---|---|---|---|---|
| ||||
|
- Select OK
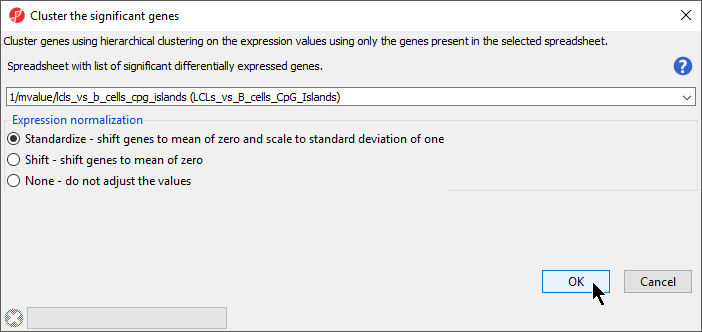
- Verify that LCLs_vs_Bcells_CpG_Islands is selected in the drop-down menu
- Verify that Standardize is selected for Expression normalization (Figure 2)
| Numbered figure captions | ||||
|---|---|---|---|---|
| ||||
|
- Select OK
The heat map will be displayed on the Hierarchical Clustering tab (Figure 3).
| Numbered figure captions | ||||
|---|---|---|---|---|
| ||||
|
| Page Turner | ||
|---|---|---|
|
| Additional assistance |
|---|
|
| Rate Macro | ||
|---|---|---|
|
Overview
Content Tools