Page History
...
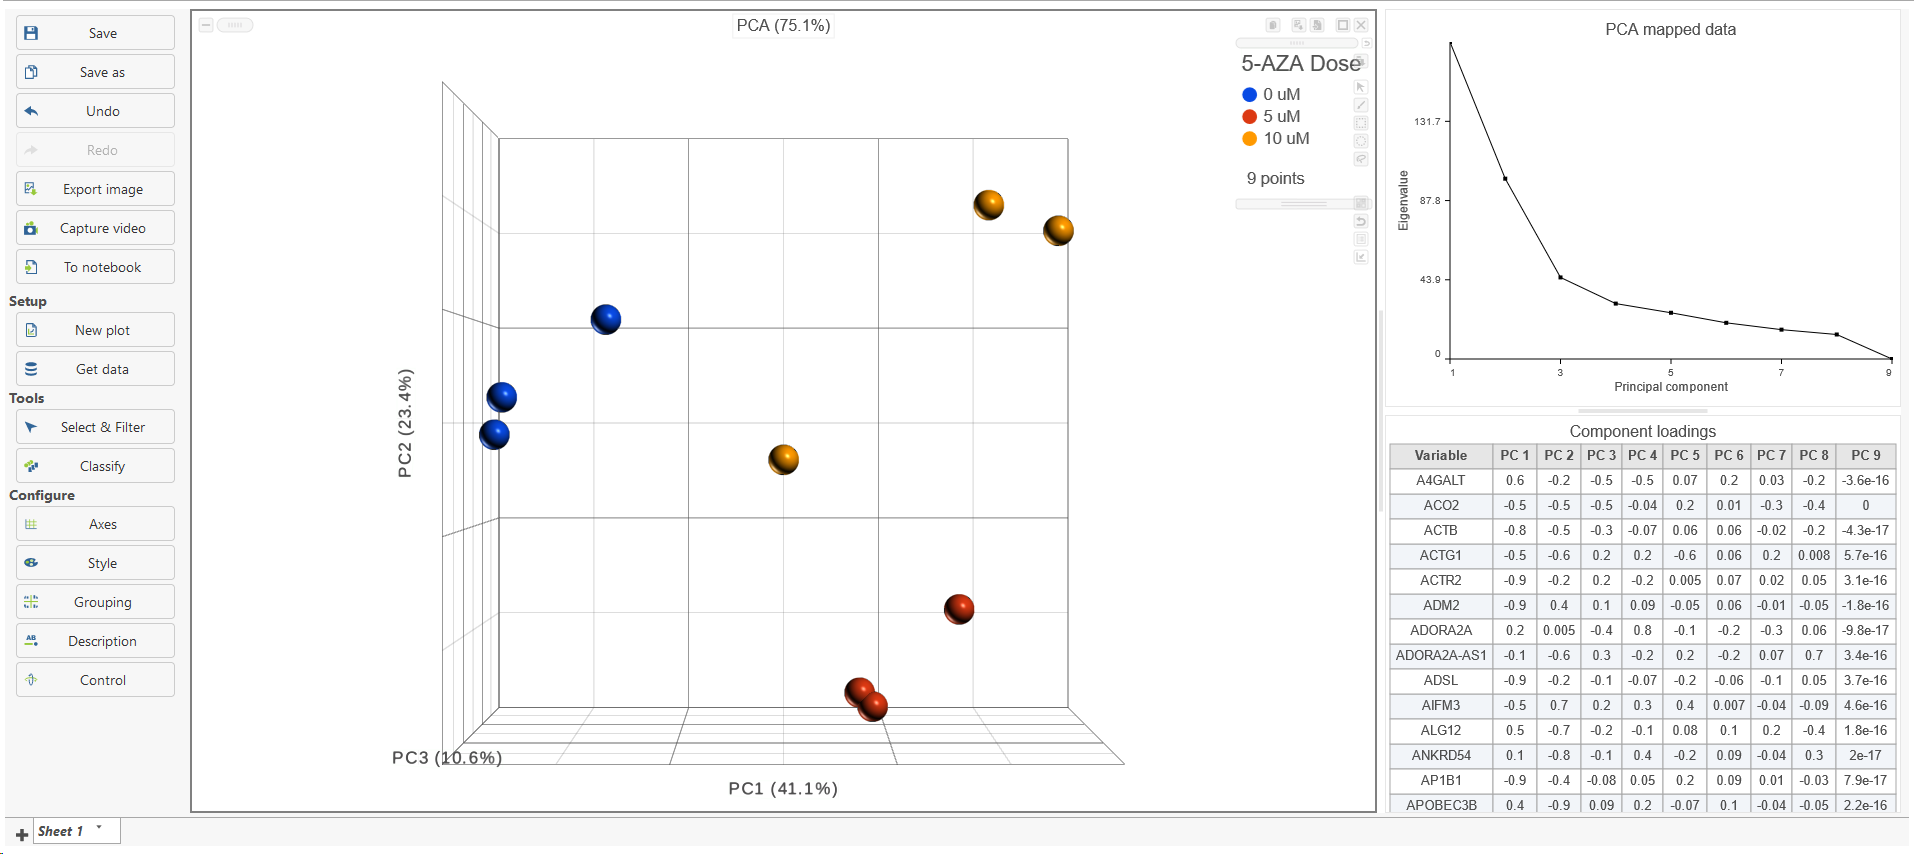
When open PCA node in Data viewer, by default, it is the 3D scatterplot , Scree plot with Eigenvalues, and Component loadings table (Figure 2), each dot on the plot represents an observation, while the first three PCs are shown on the X-, Y-, and Z-axis respectively, with the information content of an individual PC is in the parenthesis.
...
| Numbered figure captions | ||||
|---|---|---|---|---|
| ||||
|

To rotate the plot left click & drag. To zoom in or out, use the mouse wheel. Click and drag the legend can move the legend to different location on the viewer.
...
Overview
Content Tools