Page History
...
| Numbered figure captions | ||||
|---|---|---|---|---|
| ||||
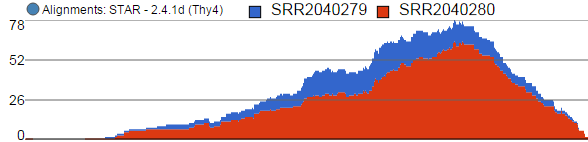
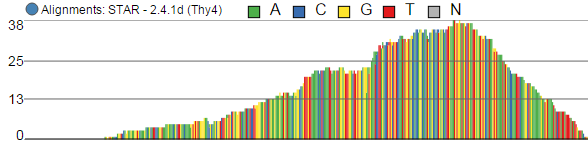
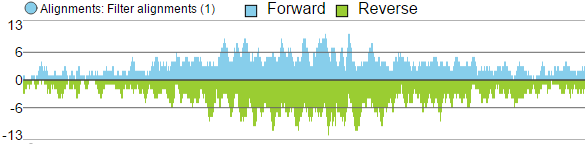
Reads coloured by sample Reads coloured by base calls Reads split by strand
|
...
As with the Reads pileup track, probes may not be visible with low power magnification and you will see a message - Zoom in to view individual microarray probes.
Peaks Track
The Peaks track displays the results of peak caller tasks. It displays a bar that spans genomic location of each peak call. If summits are identified by the peak caller, such as the MACS2 algorithm, then its genomic location is marked by a vertical line. The color marks either the pair being compared by the peak caller or, if present, the sample attribute associated with the sample.
| Numbered figure captions | ||||
|---|---|---|---|---|
| ||||
|

| Additional assistance |
|---|
|
| Page Turner | ||
|---|---|---|
|
...
Overview
Content Tools