Page History
...
| Numbered figure captions | ||||
|---|---|---|---|---|
| ||||
|
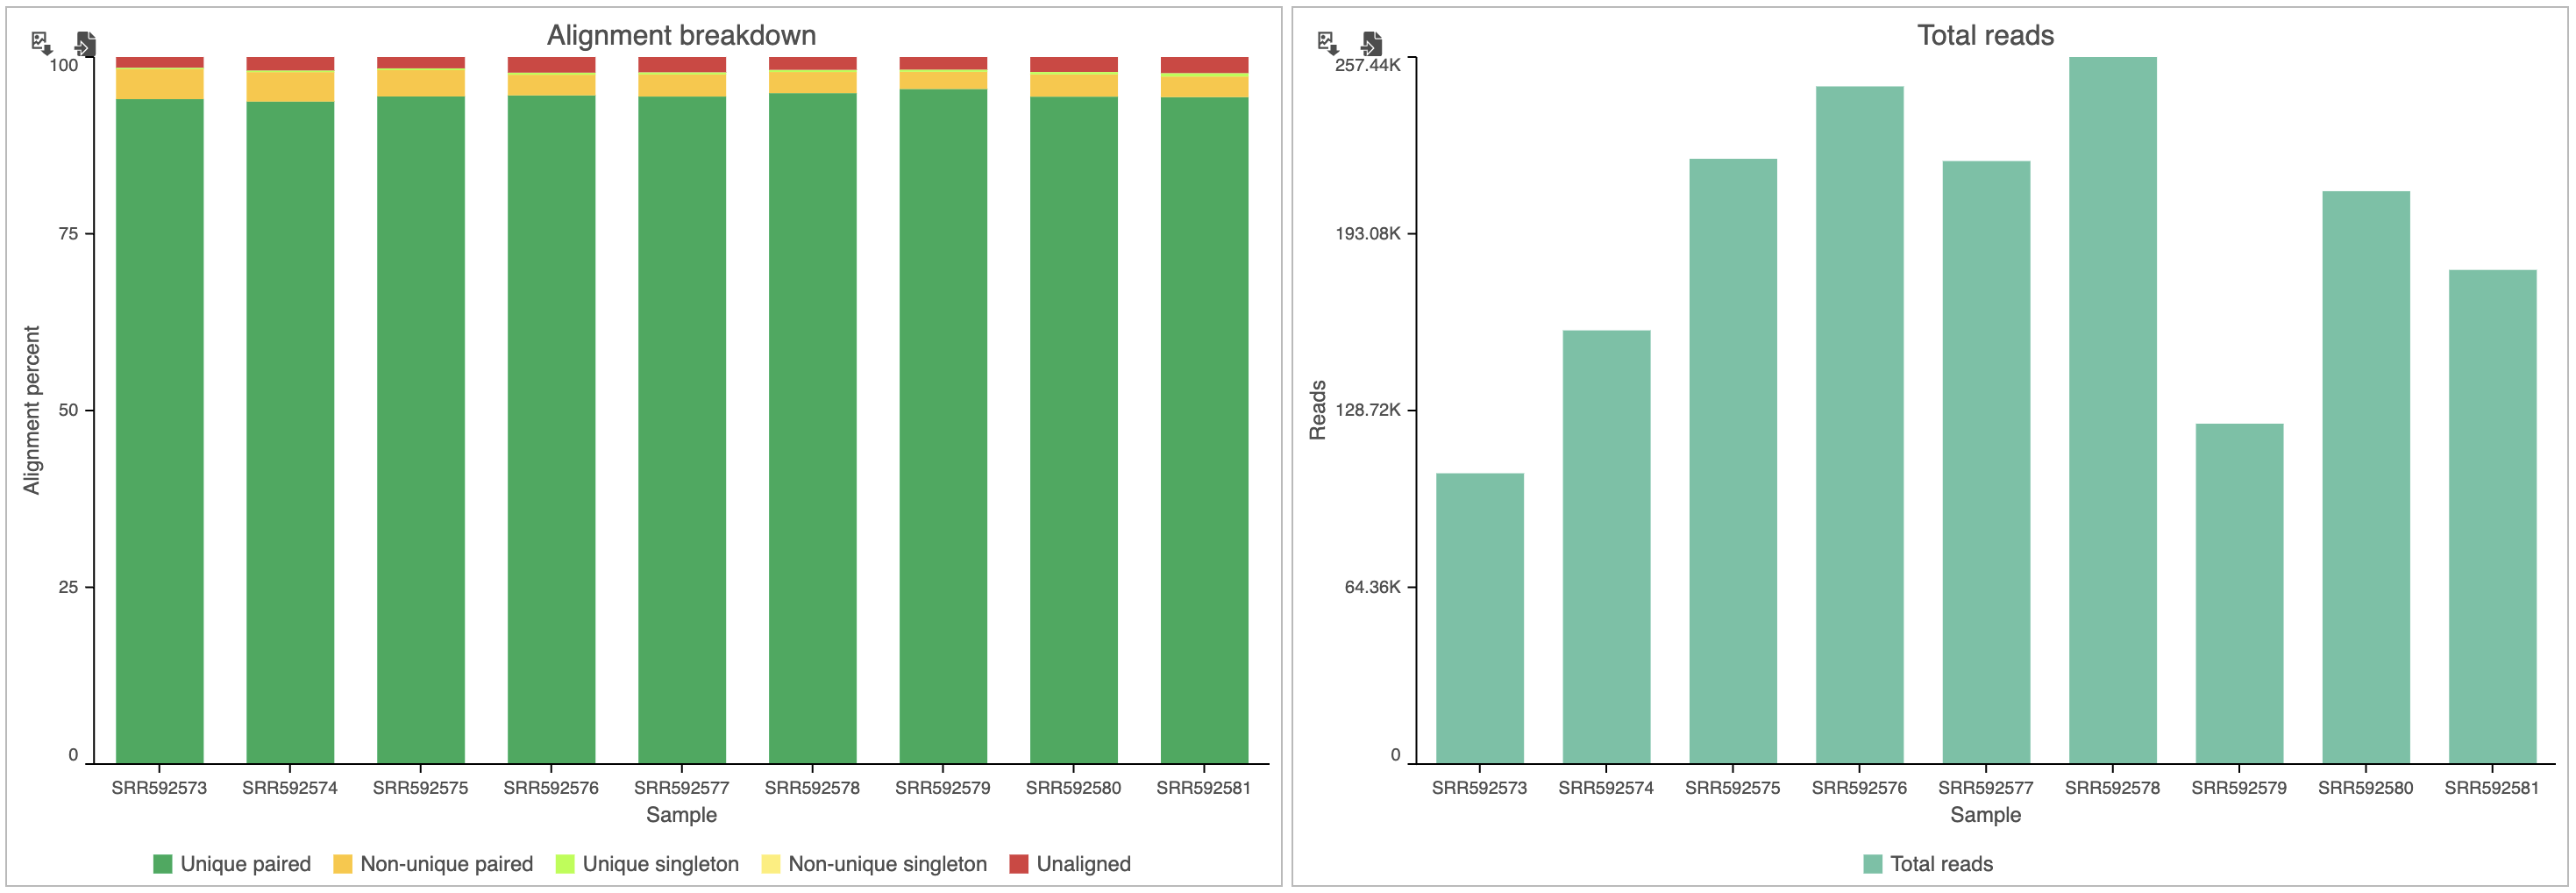
From these graphs, we can see that more than 95% of reads were aligned, but the total number of reads for each sample varies. Normalizing for the variability in total read counts will be addressed in a later section of the tutorial.
...
Overview
Content Tools