Page History
...
| Numbered figure captions | ||||
|---|---|---|---|---|
| ||||
|
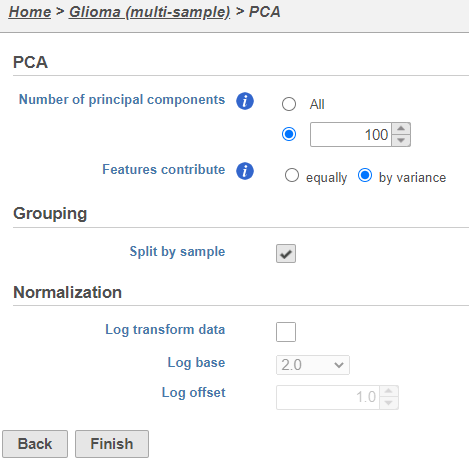
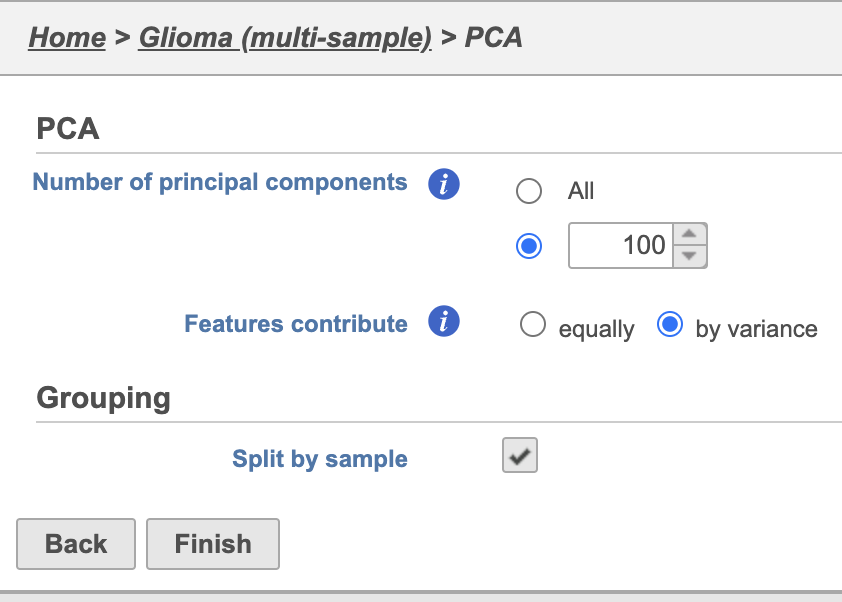
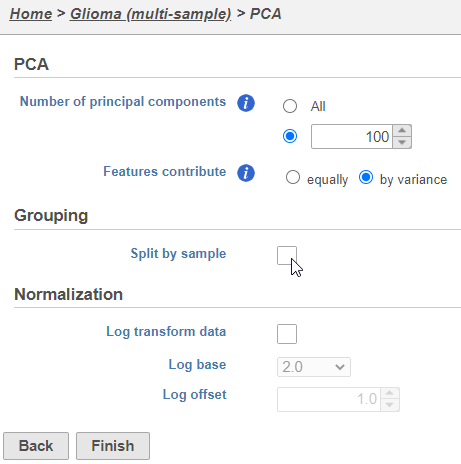
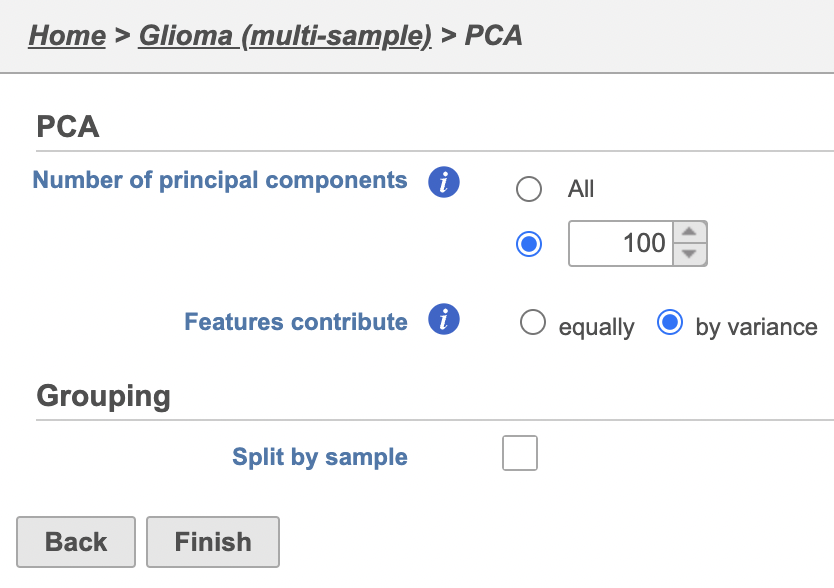
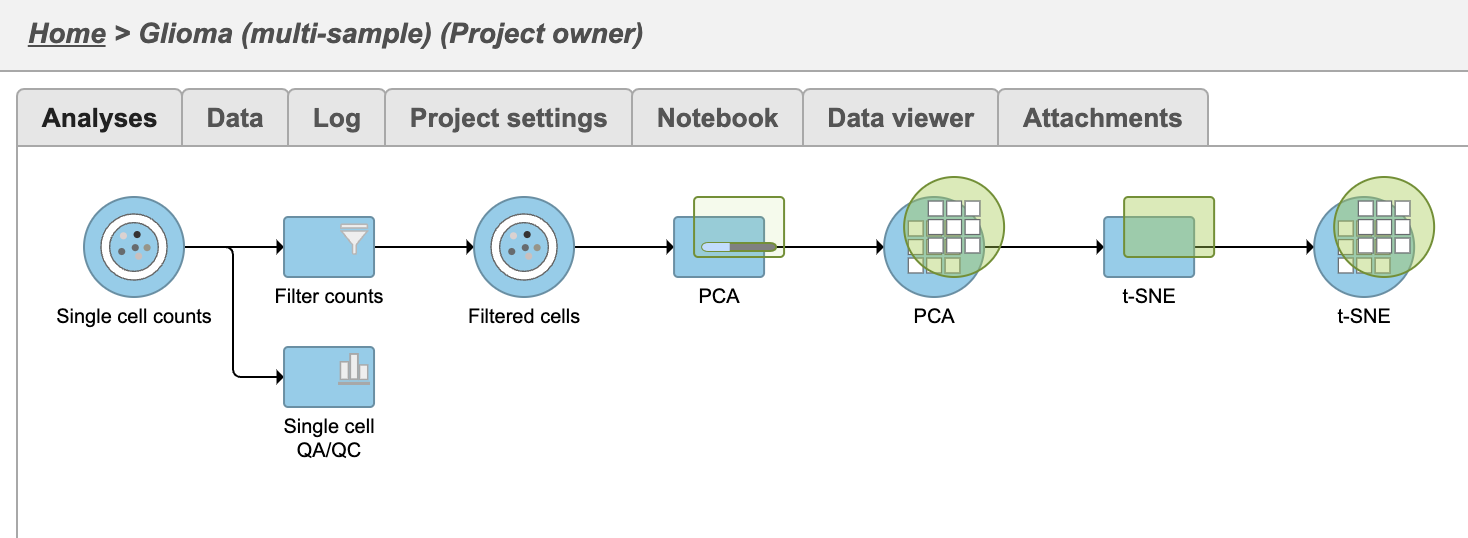
PCA task and data nodes will be generated.
...
| Numbered figure captions | ||||
|---|---|---|---|---|
| ||||
|
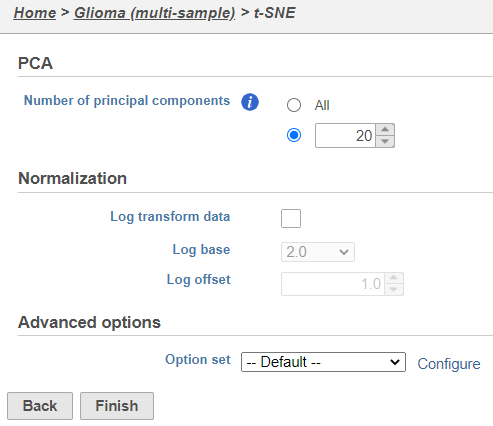
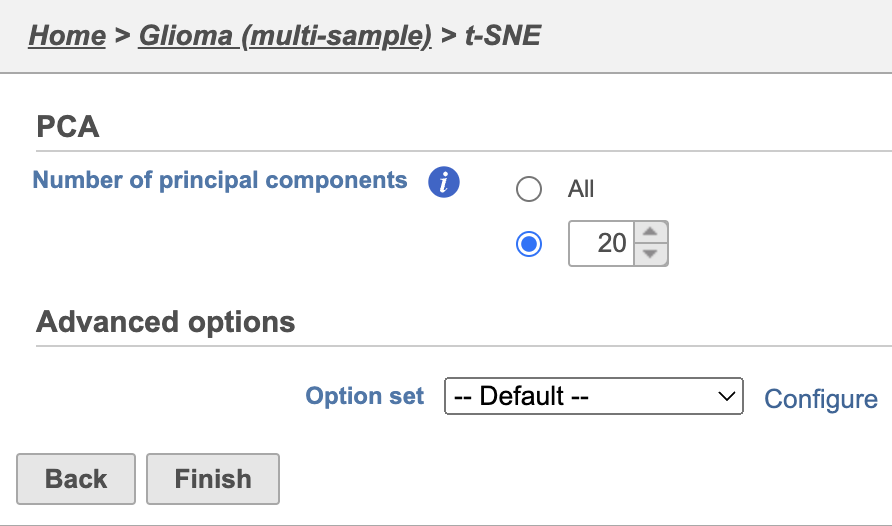
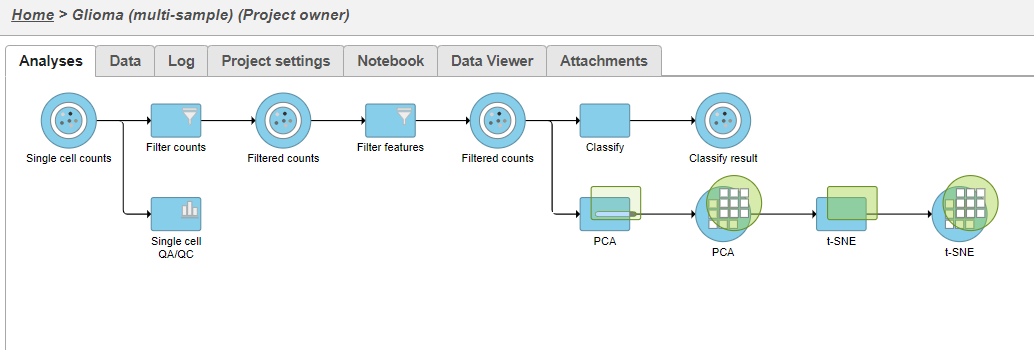
Because the upstream PCA task was performed separately for each sample, the t-SNE task will also be performed separately for each sample. t-SNE task and data nodes will be generated (Figure 5).
...
| Numbered figure captions | ||||
|---|---|---|---|---|
| ||||
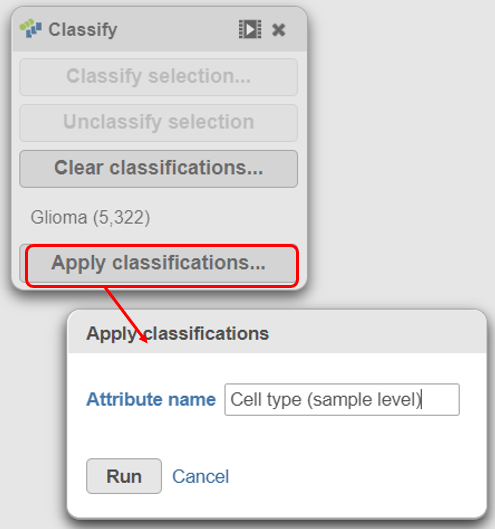 |
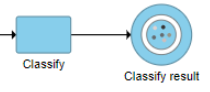
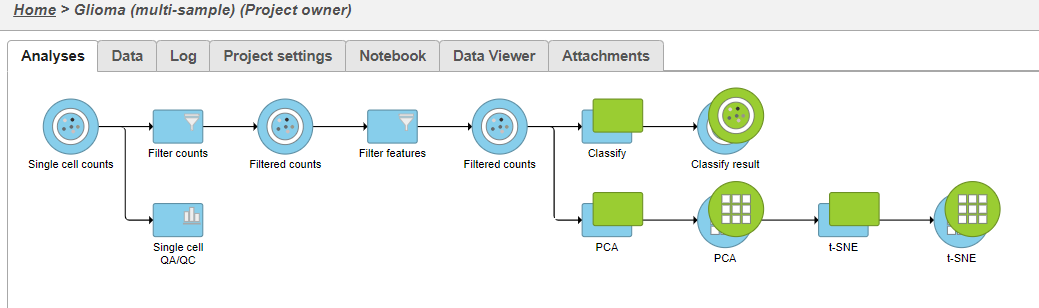
A new task, Classify, is added to the Analyses tab. This task produces a new Classify result data node (Figure 20).The new attribute is stored in the Data tab and is available to any node in the project.
- Click on the Glioma (multi-sample) project name at the top to go back to the Analyses tab
- Your browser may warn you that any unsaved changes to the data viewer session will be lost. Ignore this message and proceed to the Analyses tab
| Numbered figure captions | ||||
|---|---|---|---|---|
| ||||
|
- Double-click the new Classify result data node to open the task report (Figure 21)
The Classification summary table shows a breakdown of the number of glioma cells that were classified per sample. The cells that were not classified are labeled N/A.
The Top marker features per label table shows the top 10 upregulated genes in each cell type. In this case, the glioma cells are compared to the N/A cells using ANOVA and the genes are filtered for fold-change >1.5 and sorted by descending fold-change values. To obtain the full list of biomarker genes with p-values and fold-changes, click the Download link in the bottom right of the table.
| Numbered figure captions | ||||
|---|---|---|---|---|
| ||||
|

One multi-sample t-SNE plot
...
| Numbered figure captions | ||||
|---|---|---|---|---|
| ||||
|
The PCA task will run as a new green layer.
...
| Numbered figure captions | ||||
|---|---|---|---|---|
| ||||
|
Once the task has completed, we can view the plot.
...
| Numbered figure captions | ||||
|---|---|---|---|---|
| ||||
|
A new task, Classify, is added to the Analyses tab. This task produces a new Classify result data node in a green layer (Figure 32).The new attribute is now available for downstream analysis.
- Click on the Glioma (multi-sample) project name at the top to go back to the Analyses tab
- Your browser may warn you that any unsaved changes to the data viewer session will be lost. Ignore this message and proceed to the Analyses tab
| Numbered figure captions | ||||
|---|---|---|---|---|
| ||||
|
| Page Turner | ||
|---|---|---|
|
...
Overview
Content Tools