Page History
...
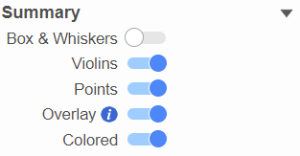
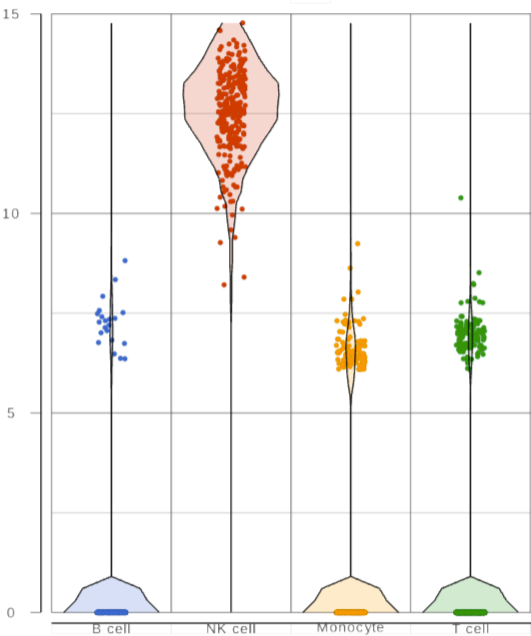
When you have a lot of observations to display, you can choose to plot box-whiskers and/or violin plot on the graph (Figure 3), by turn on/off the options to display different type of plots.
| Numbered figure captions | ||||
|---|---|---|---|---|
| ||||
|
...
Overview
Content Tools