Page History
...
| Numbered figure captions | ||||
|---|---|---|---|---|
| ||||
|
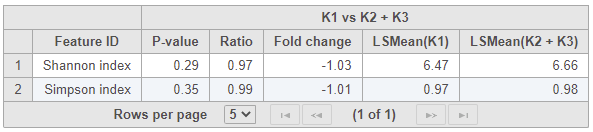
At the bottom, there is a bar chart summarizing the Shannon and Simpson metrics for each sample (Figure 4).
...
Overview
Content Tools
...
| Numbered figure captions | ||||
|---|---|---|---|---|
| ||||
|
At the bottom, there is a bar chart summarizing the Shannon and Simpson metrics for each sample (Figure 4).
...