Page History
...
| Numbered figure captions | ||||
|---|---|---|---|---|
| ||||
|

Basic UMAP parameters
Initialize output values
...
Sets the initialization mode. Options are Spectral and Random.
...
Select Any to run on all features or pick a feature type.
Advanced UMAP parameters
Local neighborhood
...
size
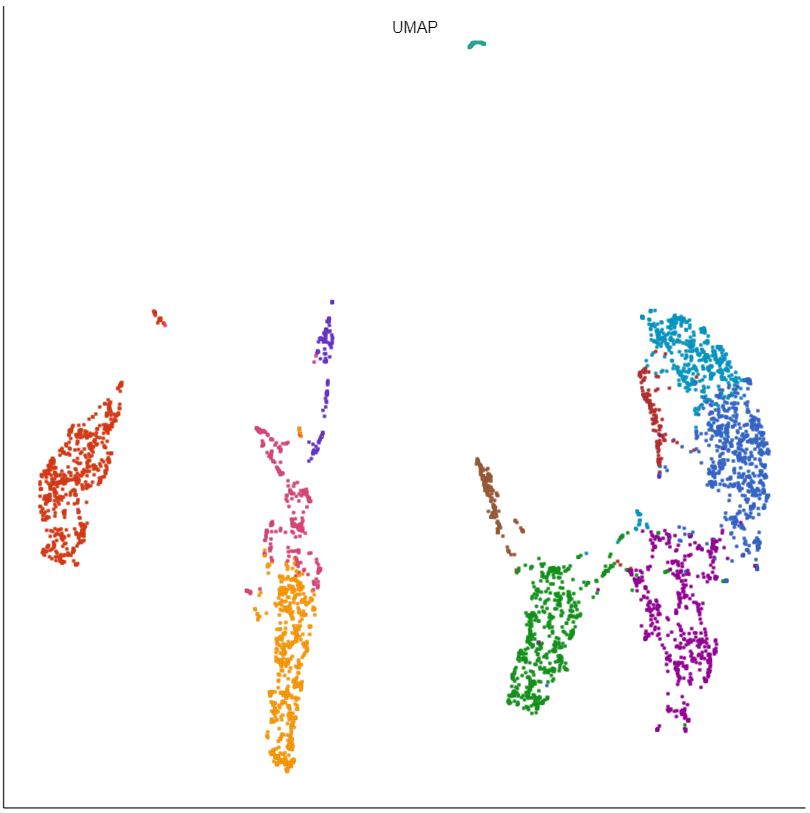
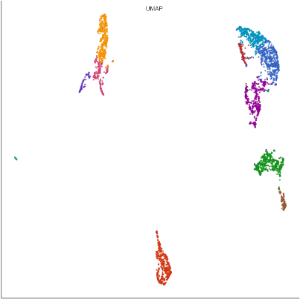
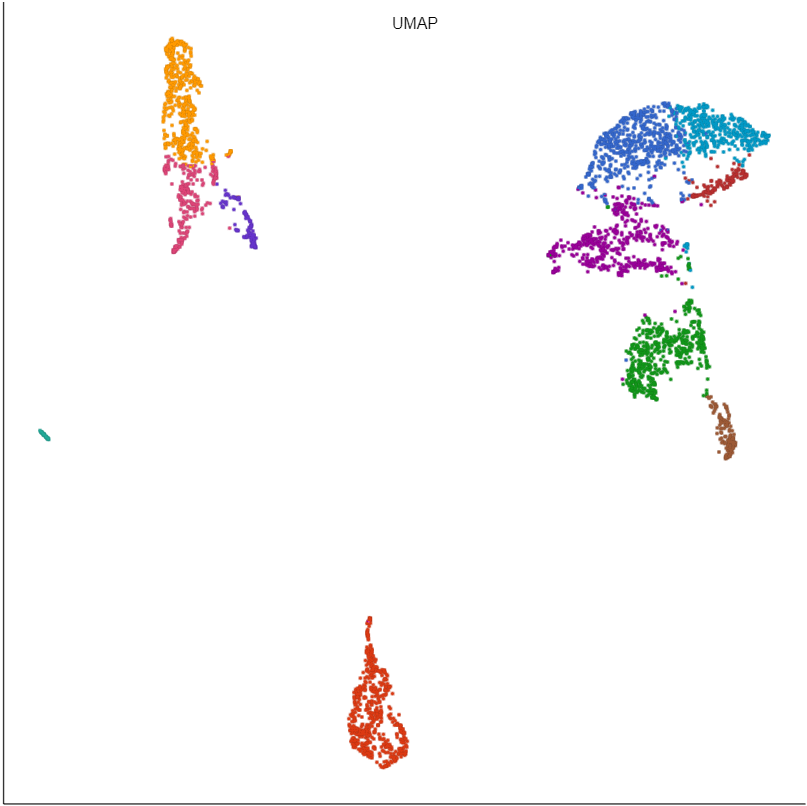
UMAP preserves the local structure of the data by focusing on the distances between each point and its nearest neighbors. Local neighborhood size is the number of nearest neighbors to consider.
...
| Numbered figure captions | ||||
|---|---|---|---|---|
| ||||
|
Minimal distance
...
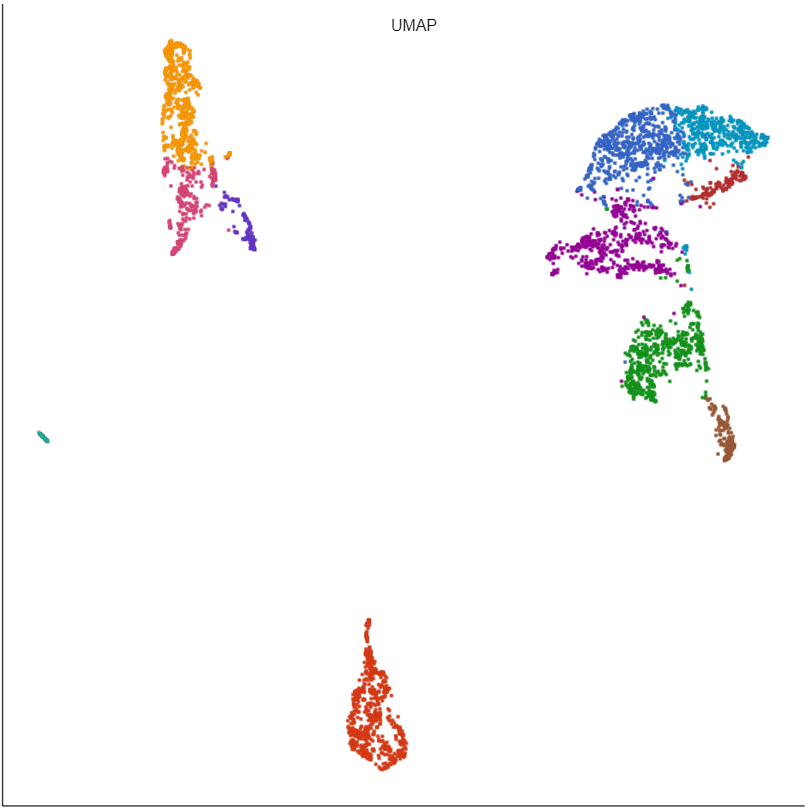
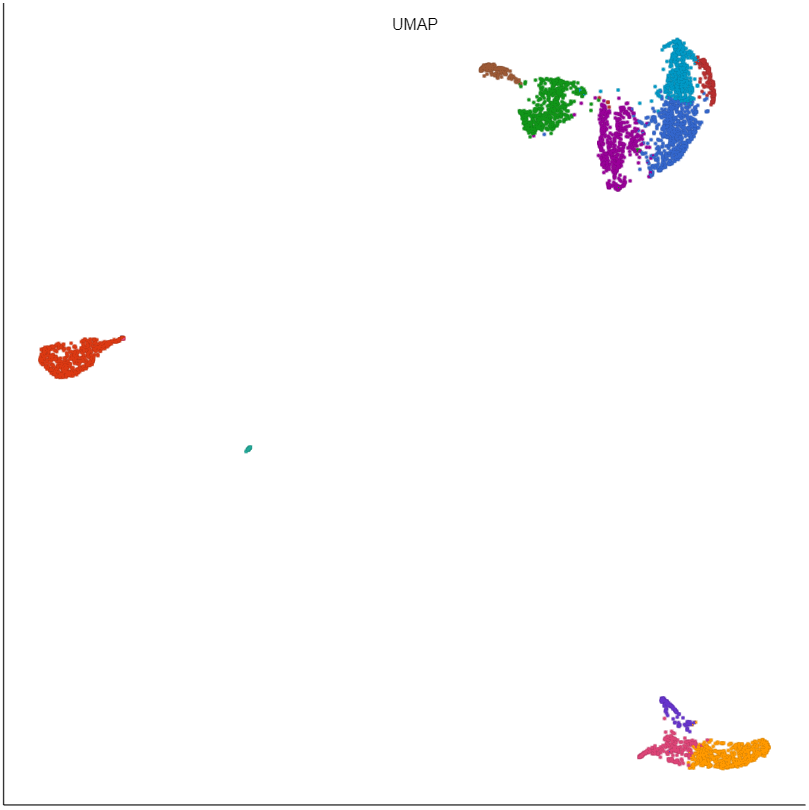
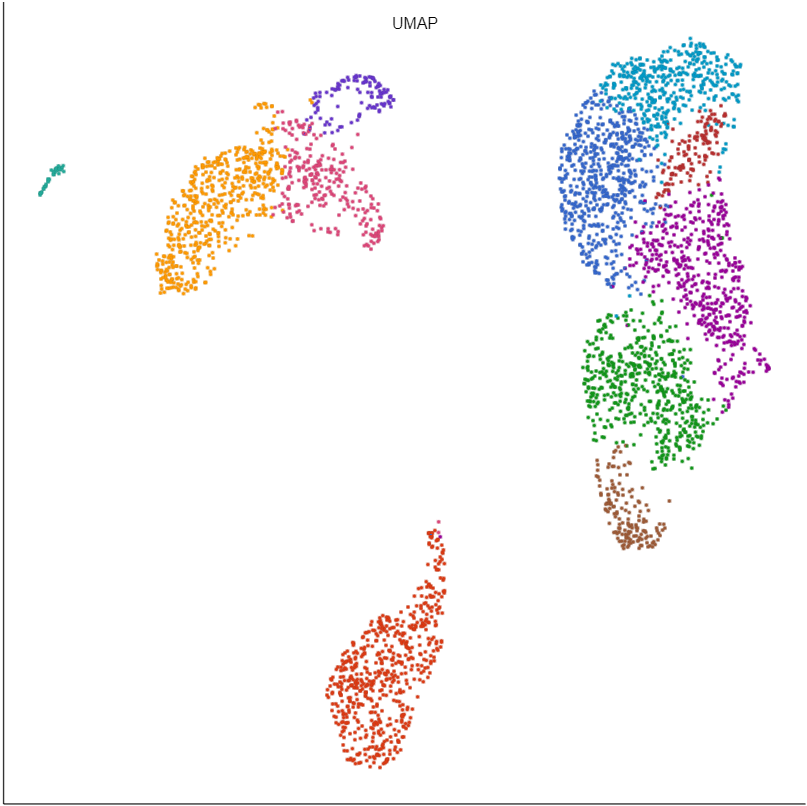
The effective minimum distance between embedded points. Smaller values will create a more clustered embedding, while larger values will create a more evenly dispersed embedding.
...
| Numbered figure captions | ||||
|---|---|---|---|---|
| ||||
|
Distance metric
...
The metric to use when computing distances in high-dimensional space. Options are Euclidean, Manhattan, Chebyshev, Canberra, Bray Curtis, and Cosine. Default is Euclidean.
Number of iterations
...
UMAP uses an iterative algorithm to optimize the low-dimensional representation. The value 0 corresponds to the default, which chooses the number of iterations based on the size of the input data. More iterations will result in a more accurate embedding, but will take longer to run. Default is 0.
Random generator
...
seed
Several parts of UMAP utilize a random number generator to provide an initial value. The value 0 corresponds to the default of the underlying algorithm. Default is 0. To reproduce the results, use the same random seed at all runs.
Generate UMAP table
Output a UMAP table data node that can be downloaded. The 2D UMAP coordinates are labeled Feature 1 and Feature 2; the 3D UMAP coordinates are labeled Feature 3, 4, and 5. Default is disabled.
...
Overview
Content Tools