Page History
...
Alternative splicing results in a single gene coding for multiple protein isoforms, so this task can only be invoked from transcript level data. The algorithm is is based on ANOVA to detect genes with multiple transcripts showing expression changes differently in different biology groups, e.g. a gene has two transcripts: A and B, transcript A is showing up-regulation in the treated group comparing to the control group, and while B is showing down regulation in treated group.
...
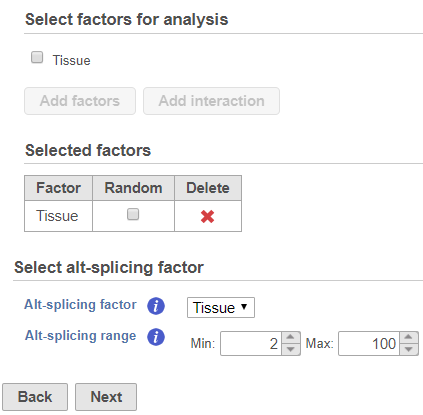
The alt-splicing dialog is very similar to ANOVA dialog, since the analysis is based on the ANOVA model specified. To setup an ANOVA model, select first chose factors from the available sample attributes. The factors can be categorical or numeric attribute(s). Click on a check button box to select and click Add factors button to add it a factor to the model (Figure 1).
| Numbered figure captions | ||||
|---|---|---|---|---|
| ||||
|
- Transcript ID effect: not all transcripts
...
- of a gene
...
- are expressed at the same level, so transcript ID is added to the model to account for transcript-to.transcript differences.
- Interaction of transcript ID with alt-splicing factor:
...
- that effect is used to estimate whether different transcripts have different expression among the levels of the same factor.
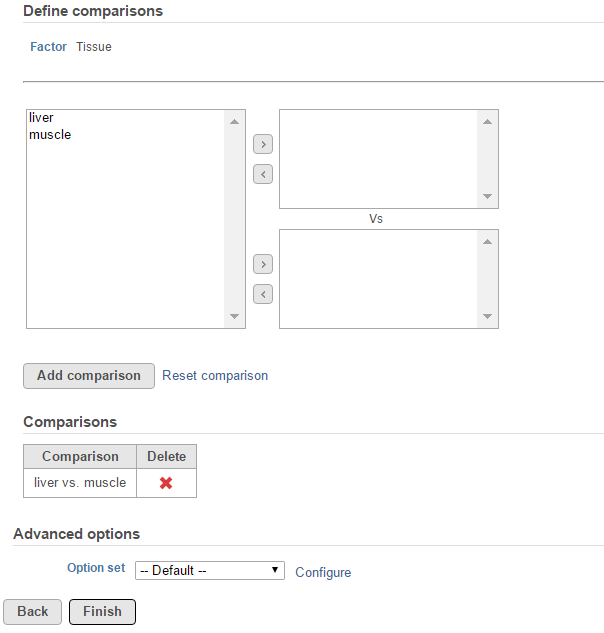
Suppose there is an experiment designed to detect transcripts showing differential expression in two tissue groups: liver vs muscle. The alt-splicing ANOVA dialog allows you to specify the ANOVA model that in this analysis is tissue, the Tissue. The alt-splicing factor is chosen from the ANOVA factor(s), so the alt-splicing factor is also tissue Tissue (Figure 1). Click Next to setup the comparisons (Figure 2)
| Numbered figure captions | ||||
|---|---|---|---|---|
| ||||
|
...
Click on the Configure to customize Advanced options (Figure 3).
| Numbered figure captions | ||||
|---|---|---|---|---|
| ||||
|
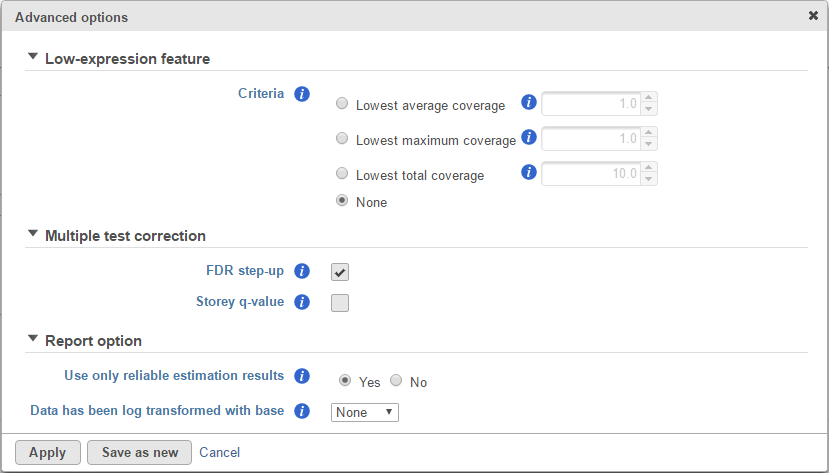
Report option
User only reliable estimation results: There are situations when a model estimation procedure does not fail outright, but still encounters some difficulties. In this case, it can even generate p-value and fold change on the comparisons, but they are not reliable, i.e. they can be misleading. Therefore, the default of Use only reliable estimation results is set is set to Yes.
Data has been log transformed with base: showing the current scale of the input data on this task.
Alt-splicing ANOVA report
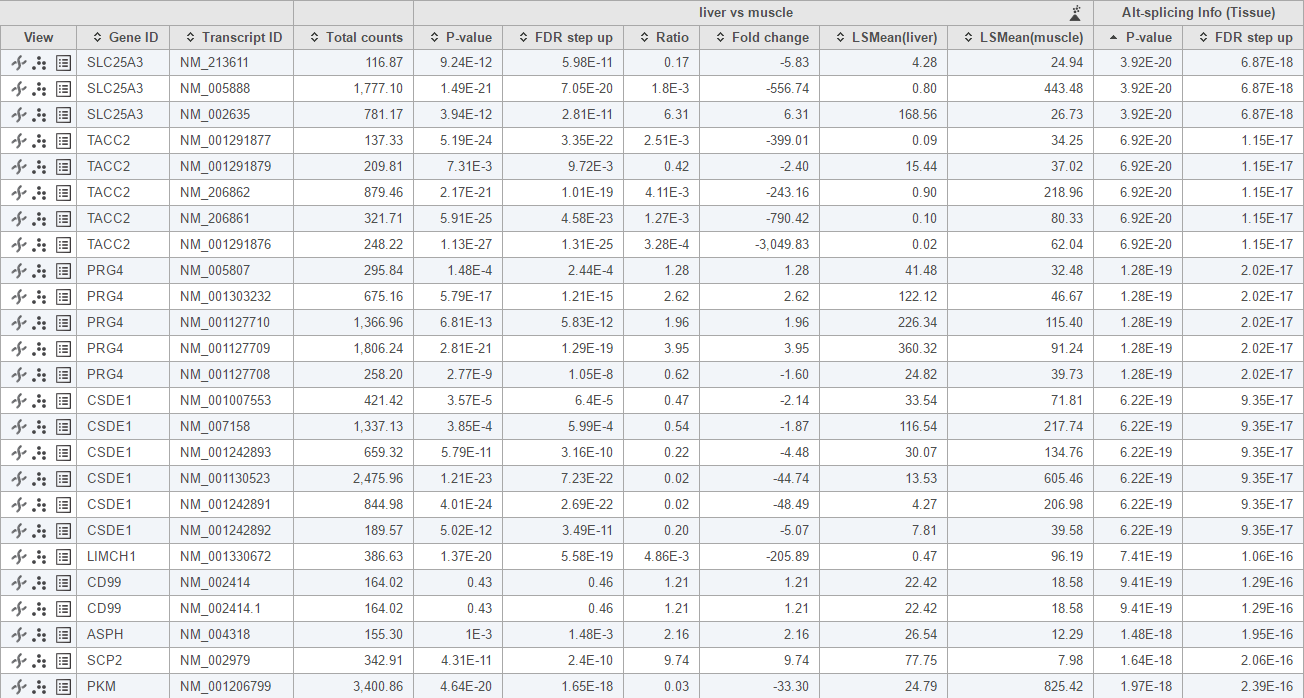
This For this analysis, only genes with more than one transcripts transcript will be included in the calculation. The report format is the same as ANOVA report, each row represent a transcript, and besides statistics information on the specified comparisons, there is also Altalt-splicing information at the right end of the table, this . That information is represented by the p-value of interaction of transcript ID with alt-splicing factor, . Note that the transcripts of the same gene should have the same p-value. Small p-value indicate significance of the gene undergo indicates significant alt-splicing event, by default hence the table is sorted based on this that p-value by default (Figure 4).
| Numbered figure captions | ||||
|---|---|---|---|---|
| ||||
|
To visualize the difference, click on the Browse to location view icon ( ) to visualize the difference (Figure 5). The 3rd exon is differentially expressed between NM_005888 and NM_002635. Muscle primarily expresses NM_005888 while liver primarily uses NM_002635.
| Numbered figure captions | ||||
|---|---|---|---|---|
| ||||
|
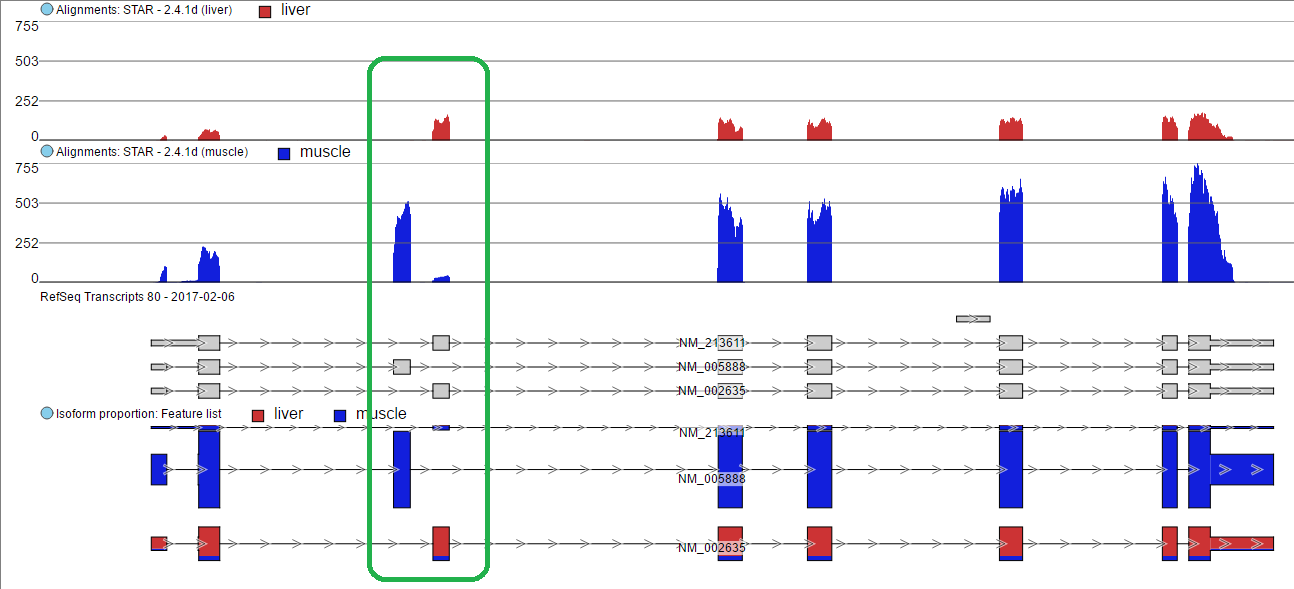
The 3rd exon is different between NM_005888 and NM_002635. Muscle primarily expressed in NM_005888 while liver primarily expressed in NM_002635.
| Additional assistance |
|---|
| Rate Macro | ||
|---|---|---|
|
...
Overview
Content Tools