Join us for a webinar: The complexities of spatial multiomics unraveled
May 2
Page History
...
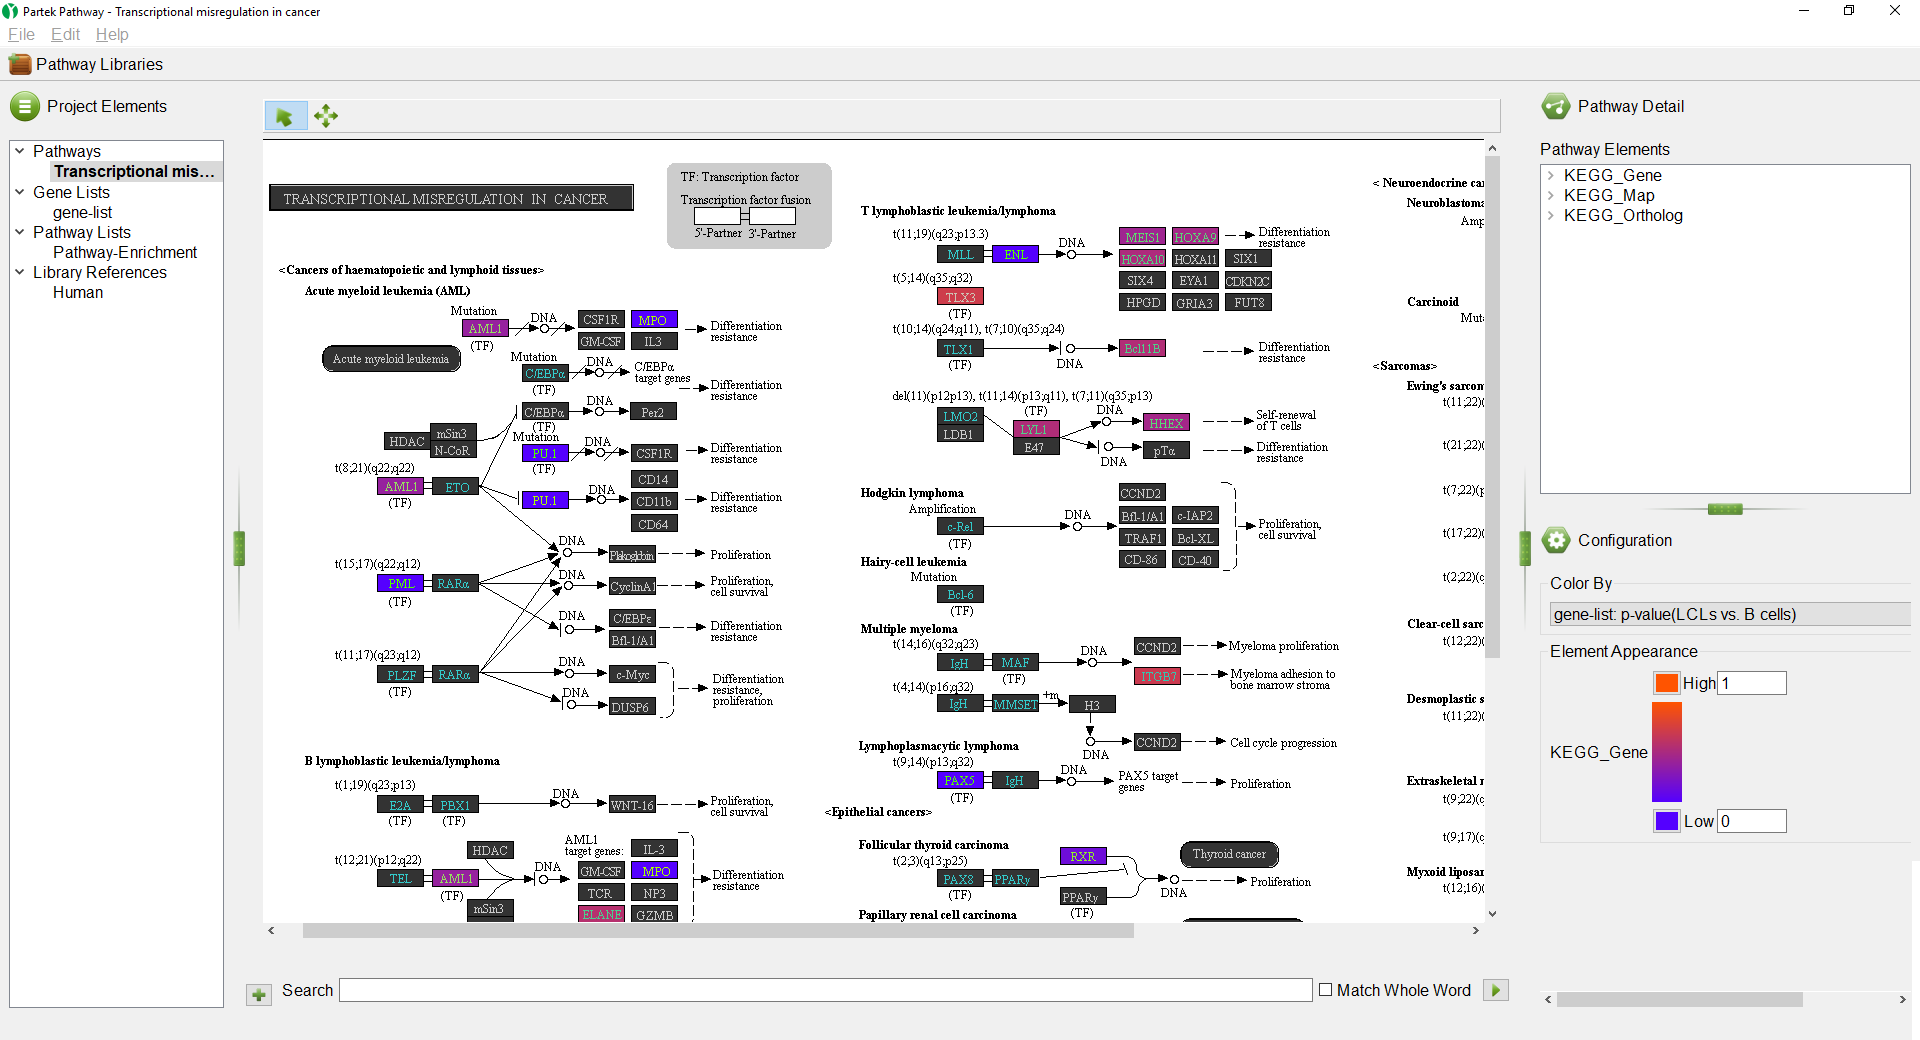
ThePathway-Enrichment spreadsheet will be added to the spreadsheet tree in Partek Genomics Suite and the Partek® Pathway™ software will open to provide visualization of the most significantly enriched pathway as a pathway diagram (Figure 5). The color of the gene boxes reflects p-values of the associated differentially methylated CpG loci (bright orange is insignificant, blue is highly significant). The Color by option can be changed another column from the gene-list.txt spreadsheet., such as Difference Difference.
| Numbered figure captions | ||||
|---|---|---|---|---|
| ||||
|
...
Overview
Content Tools