Page History
...
| Numbered figure captions | ||||
|---|---|---|---|---|
| ||||
|
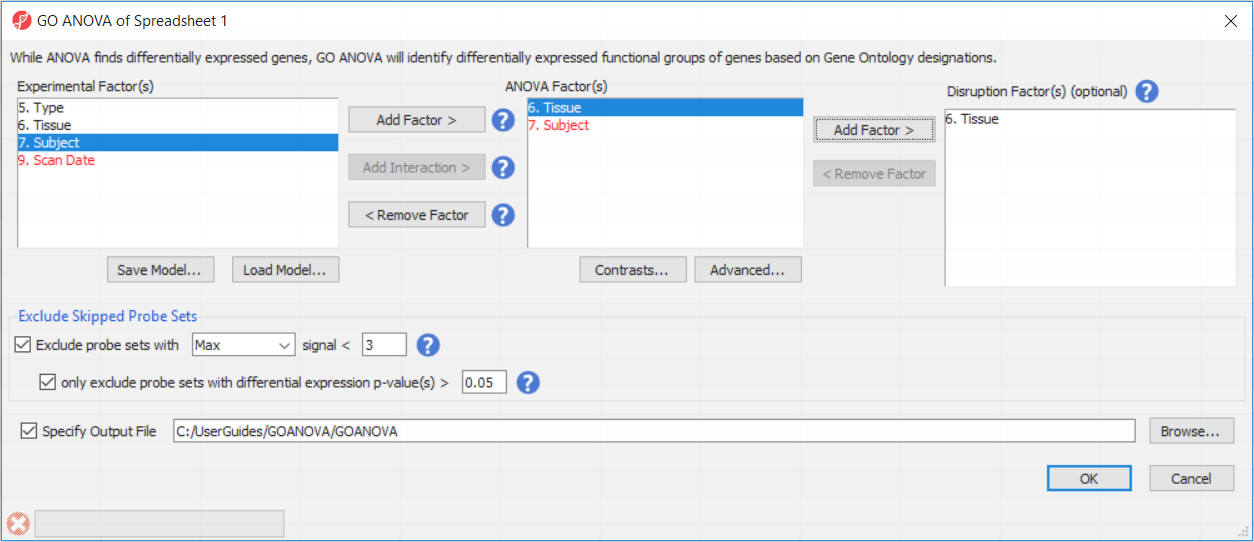
For this example analysis, the model was kept easy to interpret by including Subject and Tissue as the only ANOVA factors. Additionally, Tissue was added to the Disruption Factor(s). Including Subject controled for person to person variation, and including Tissue allowed the analysis of differential expression and of functional category disruption between tissue types. For the sake of simplicity and minimizing run time, the term Subject was not added to the Disruption Factor(s) box. Including it would have helped correct for subject specific gene expression patterns, though the results were largely unaffected in this case.
Performing GO ANOVA analysis on very large GO categories can take quite a bit of time. More importantly, very large categories may have too large a scope to be useful. To speed the operation and analyze only smaller GO categories, specify 20 genes as the maximum size for an analyzed GO category.
For the sample dataset, the GO ANOVA dialog setup should appear as in Figure 2 below.
| Numbered figure captions | ||||
|---|---|---|---|---|
| ||||
|
| Additional assistance |
|---|
|
| Rate Macro | ||
|---|---|---|
|
Overview
Content Tools