Page History
...
| Numbered figure captions | ||||
|---|---|---|---|---|
| ||||
|
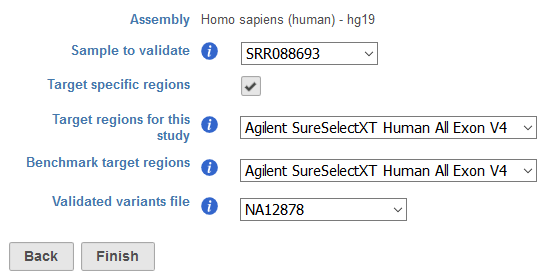
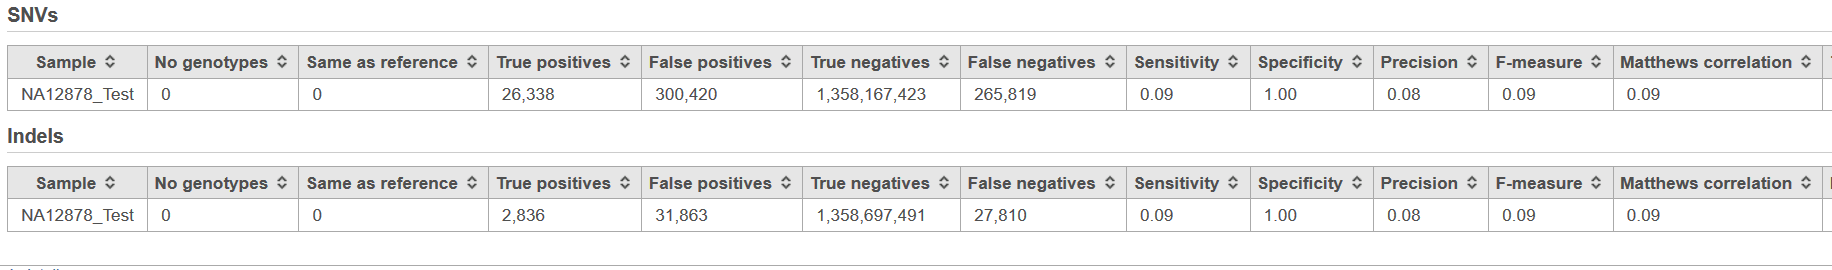
The Validate variants results page contains statistics related to the comparison of variants in the project sample compared to the "gold standard" validated variant calls for the sample (Figure 2). The results are split in to two sections, one based on metrics calculated from the comparison of SNVs and the other from the comparison of INDELs.
| Numbered figure captions | ||||
|---|---|---|---|---|
| ||||
|
The following SNP-level metrics are contained within the report, comparing the sample in the project to the validated variant data:
- No genotypes: the number of missing genotypes from the sample in the Flow project
- Same as reference: the number of homozygous reference genotypes from the sample in the Flow project
- True positives: the number of variant genotypes from the sample in the Flow project that match the validated variants file
- False positives: the number of variant genotypes from the sample in the Flow project that are not found in the validated variants file
- True negatives: the number of loci that do not have variant genotypes in the sample in the Flow project and the validated variants file
- False negatives: the number of genotypes that do not have variant genotypes in the sample in the Flow project but do have variant genotypes in the validated variants file
- Sensitivity: the proportiion of variant genotypes in the validated variants file that are correctly identified in the sample in the Flow project (true positive rate)
- Specificity: the proportion of non-variant loci in the validated variants file that are non-variant in the sample in the Flow project (true negative rate)
- Precision: the number of true positive calls divided by the number of all variant genotypes called in the the sample in the Flow project (positive predictive value),
- F-measure: a measure of the accuracy of the calling in the Flow pipeline relative to the validated variants
- Matthews correlation: a measure of the quality of classification, taking into account true and false positives and negatives
- Transitions: variant allele interchanges of purines or pyrimidines in the sample in the Flow project relative to the reference
- Transversions: variant allele interchanges of purines to/from pyrimidines in the sample in the Flow project relative to the reference
- Ti/Tv ratio: ratio of transition to transverstions in the sample in the Flow project
- Heterozygous/Homozygous ratio: the ratio of heterzyous and homozgous genotypes in the sample in the Flow project
- Percentage of sites with depth < 5: the percentage of variant genotypes in the sample in the Flow project that have fewer than 5 supporting reads
- Depth, 5th percentile: 5% of sequencing depth found across all variant genotypes in the sample in the Flow project
- Depth, 50th percentile: 50% of sequencing depth found across all variant genotypes in the sample in the Flow project
- Depth, 95th percentile: 95% of sequencing depth found across all variant genotypes in the sample in the Flow project
The INDEL-level metrics columns contained within the report are identical, with the expeption of a lack of information with regards to transitions and transversion.
| Additional assistance |
|---|
|
| Rate Macro | ||
|---|---|---|
|
Overview
Content Tools