Page History
...
| Numbered figure captions | ||||
|---|---|---|---|---|
| ||||
Alignments track
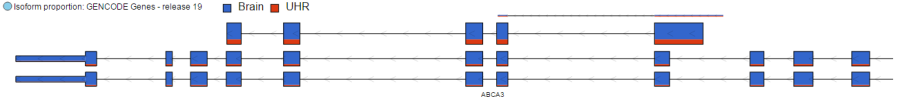
Isoform proportion track Variants track Amino acids track Reads pileup track Probe intensities track Peaks track |
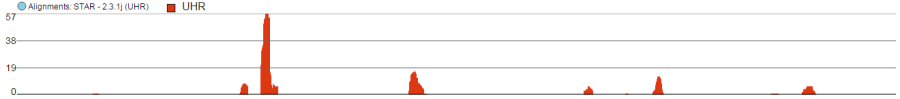


Alignments Track
Alignments track displays a view of alignments present in .bam files in a stacked histogram fashion (similar to Partek® Genomics Suite®). The y-axis shows number of (raw) base calls per position. By default, reads are coloured by sample. Variations on the track are displayed below. They can be configured in the following ways:
...
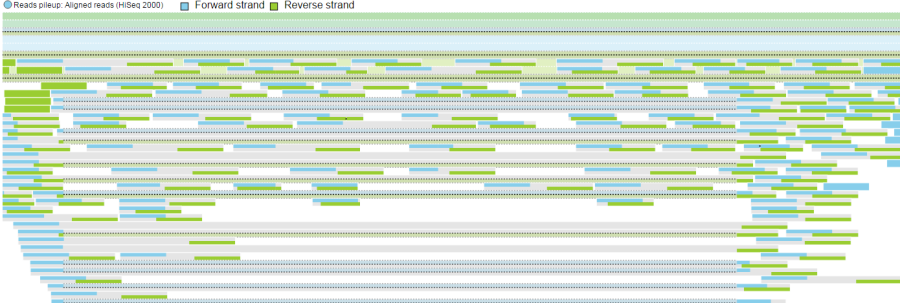
As with the Reads pileup track, probes may not be visible with low power magnification and you will see a message - Zoom in to view individual microarray probes.
Peaks Track
The Peaks track displays the results of peak caller tasks. It displays a bar that spans genomic location of each peak call. If summits are identified by the peak caller, such as the MACS2 algorithm, then its genomic location is marked by a vertical line. The color marks either the pair being compared by the peak caller or, if present, the sample attribute associated with the sample.
| Numbered figure captions | ||||
|---|---|---|---|---|
| ||||
|
...
Overview
Content Tools