Page History
...
The plot will now show a Manhattan plot.
| Numbered figure captions | ||||
|---|---|---|---|---|
| ||||
|
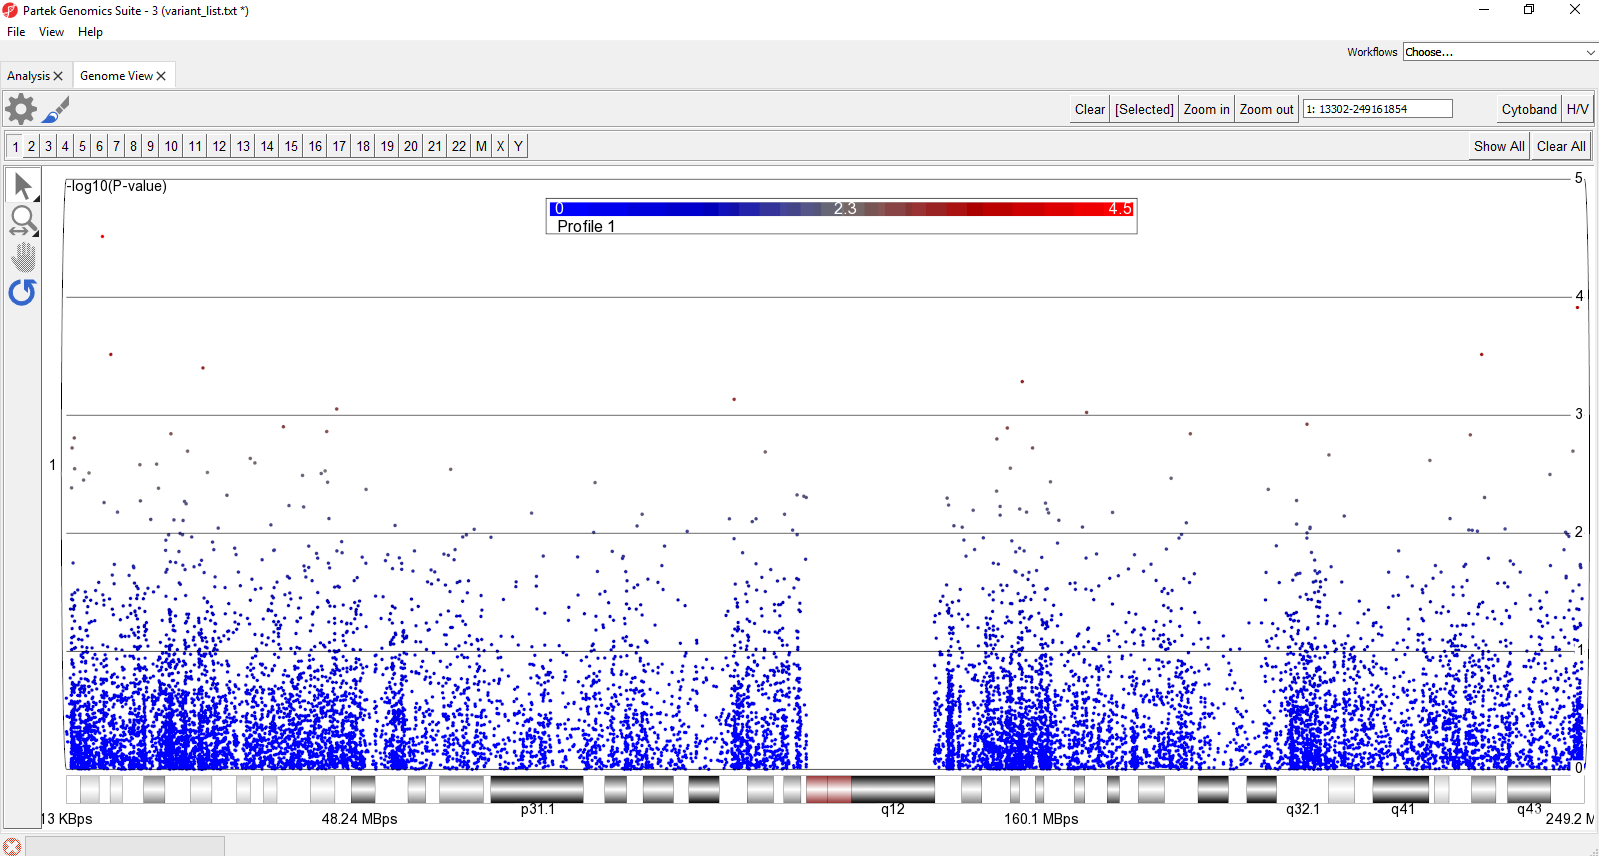
For details on Genome View see Chapter 6: The Pattern Visualization System in the Partek User's Manual.
...
Overview
Content Tools
...
The plot will now show a Manhattan plot.
| Numbered figure captions | ||||
|---|---|---|---|---|
| ||||
|
For details on Genome View see Chapter 6: The Pattern Visualization System in the Partek User's Manual.
...