Page History
...
By including Batch in the ANOVA model, the variability due to the batch effect is accounted for when calculating p-values for the non-random factors. In effect, the batch effect has already been removed. However, visualizing biological effects can be very difficult if batch effects are present. We can modify the original intensity data to remove the batch effect using the Remove Batch Effect tool.
Using the Remove Batch Effect tool
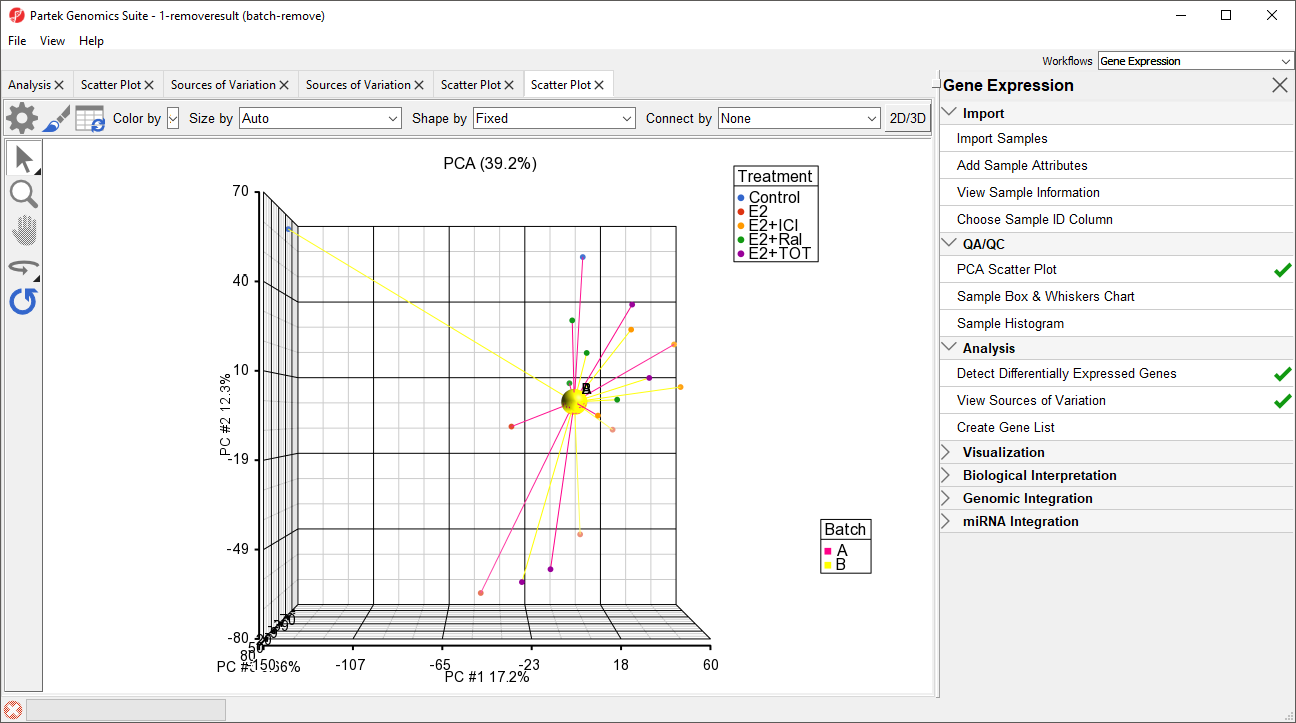
The Remove Batch Effect tool functions much like ANOVA in reverse, calculating the variation attributed to the effect being removed then adjusting the original intensity values to remove the effect. Once the effect has been removed, tools like PCA or clustering can be used to visualize what the data would look like if the batch effect was not present.
...
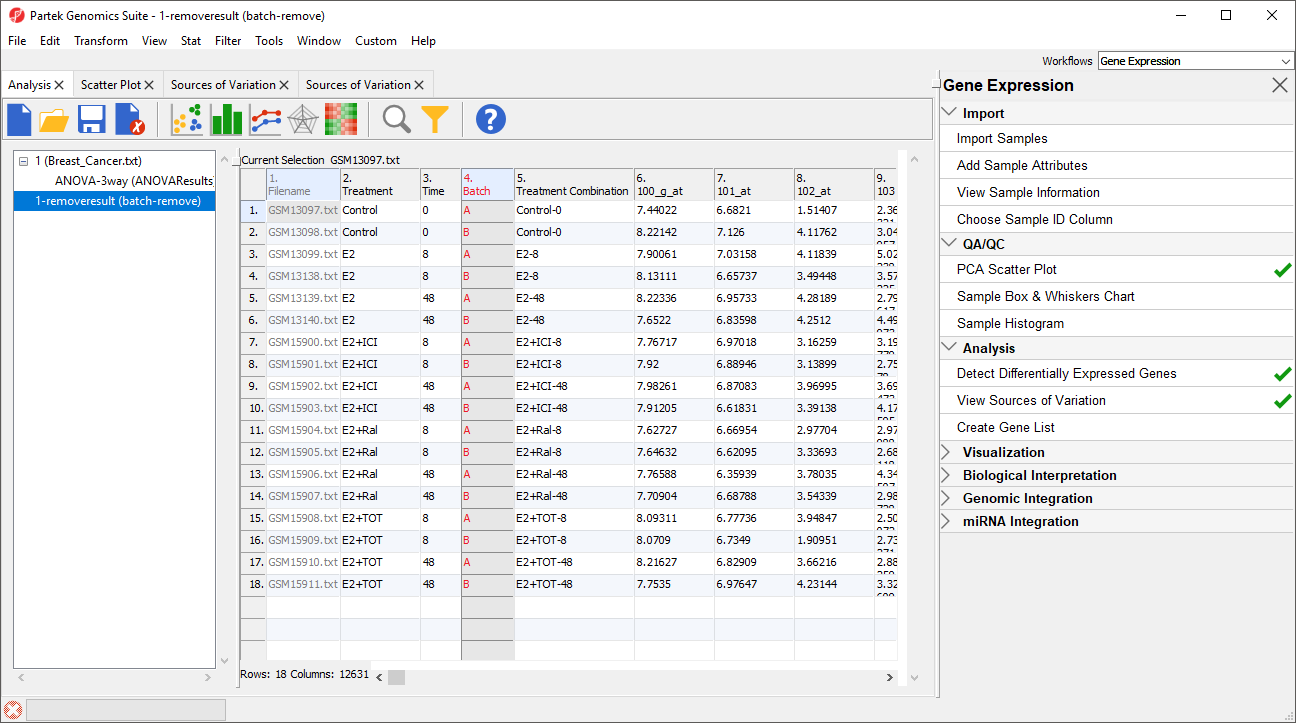
The new spreadsheet, 1-removeresult (batch-remove) will open in the Analysis tab (Figure 3).
| Numbered figure captions | ||||
|---|---|---|---|---|
| ||||
|
Batch effects in PCA
We can visualize the effects of removing the batch effects using PCA.
...
| Numbered figure captions | ||||
|---|---|---|---|---|
| ||||
|
Batch effects in ANOVA results visualizations
Visualization of ANOVA results for single probe(sets)/genes can also benefit from batch removal. To illustrate this, we first need to repeat our ANOVA using the new batch-remove intesitiy values spreadsheet.
...
Overview
Content Tools