Page History
...
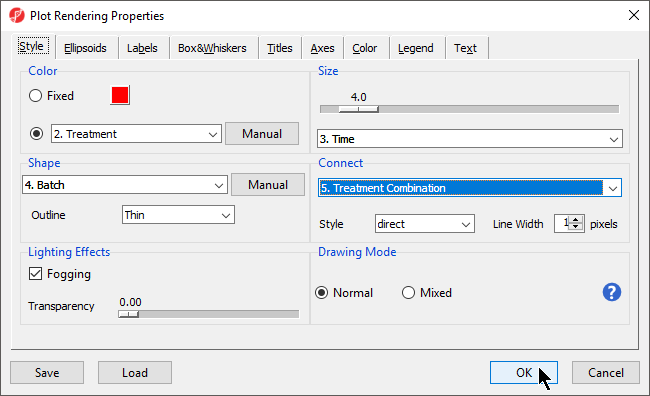
- Select (
 ) to open the ConfigurePlot Properties dialog
 - Set Shape to 4. Batch
- Set Size to 3. Time
- Set Connect to 5. Treatment Combination
- Select OK (Figure 2)
| Numbered figure captions | ||||
|---|---|---|---|---|
| ||||
|
...
| Numbered figure captions | ||||
|---|---|---|---|---|
| ||||
|
Two ways to address the batch effects in the data set will be detailed later in this tutorial.
| Additional assistance |
|---|
|
| Rate Macro | ||
|---|---|---|
|
Overview
Content Tools