Page History
...
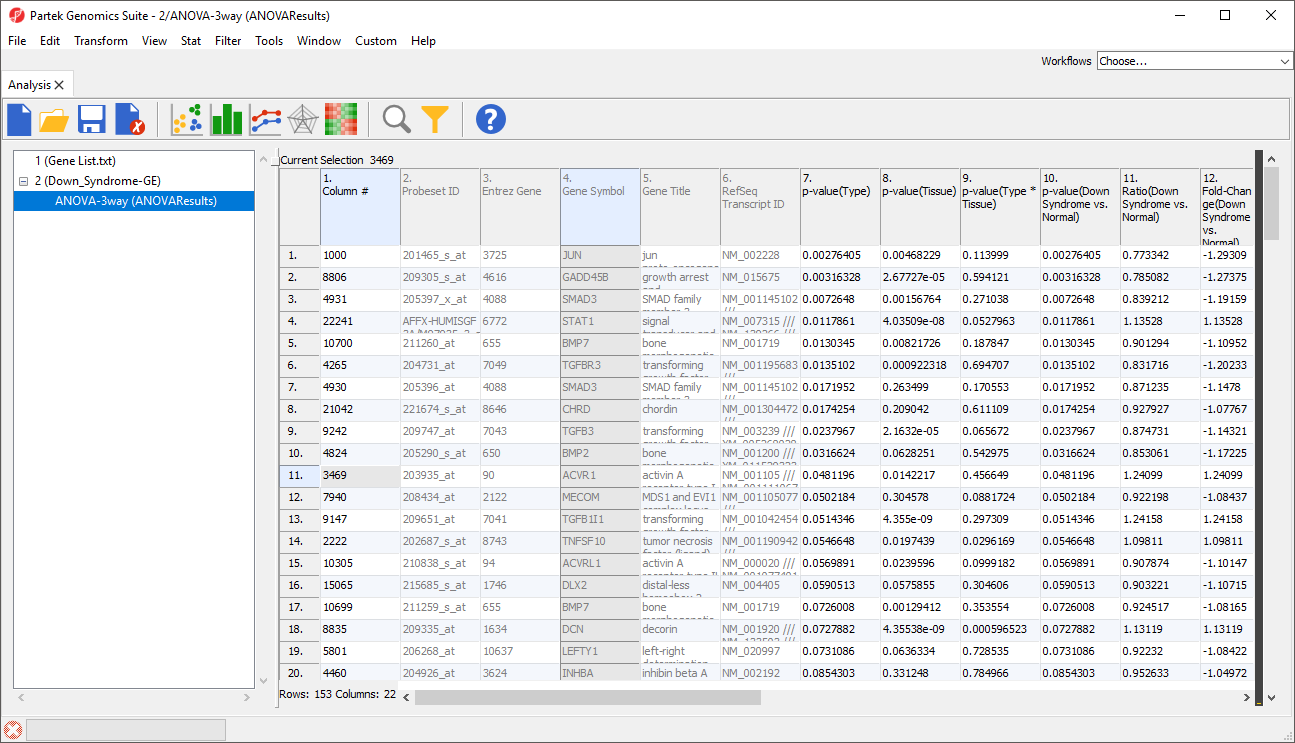
The target spreadsheet will display the filtered rows (Figure 3). Note that the number of rows has gone from 22,283 prior to filtering (Figure 1) to 153 after filtering (Figure 3).
| Numbered figure captions | ||||
|---|---|---|---|---|
| ||||
|
...
The new spreadsheet will open. If you want to use the list new spreadsheet again in the future, be sure to save it as the new spreadsheet is a temporary file.
Descriptive Statistics
There are numerous descriptive statistics available in Partek Genomics Suitefor analyzing lists with numerical data.
- Select Stat from the main toolbar
- Select either Descriptive or Correlate to show available options
...
- Select Regions in the track preferences panel to edit it
- Select the other numerical column in the Bar height by drop-down menu
Clustering
If the data is suitable for clustering, access For a gene list with numerical values, clustering can be performed. Access the clustering function through the toolbar, not form from a workflow. The workflow implementation assumes implementations assume that the data to be clustered are found on a parent spreadsheet and the list of genes is in a child spreadsheet. Because the data to be clustered is all on one spreadsheet, access hierarchical clustering by selecting Tools from the main toolbar then Discover then Hierarchical Clustering. Consider transposing the spreadsheet if samples are on columns and genes are on rows as Hierarchical Clustering will assume
- Select Tools form the main toolbar
- Select Discover then Hierarchical Clustering
Hierarchical Clustering assumes that samples are rows and genes are columns so consider transposing your data if this is not the case. If you have only have one column or one row of data, cluster only on the dimension with multiple entries categories by deselecting either deselecting either Rows or Columns from What to Cluster or consider using an intensity plot insteadCluster in the Hierarchical Clustering dialog.
| Page Turner | ||
|---|---|---|
|
...
Overview
Content Tools