GO Enrichment
The Gene Ontology (GO) Enrichment p-value calculation uses either a Chi-Square or Fisher’s Exact test to compare the genes included in the significant gene list to all possible genes present in the experiment or the background genes. For a microarray experiment, background genes consists of all genes on the chip/array; for a next generation sequencing experiment, all genes in the species transcriptome are considered background genes.
Because the calculation is essentially comparing overlapping sets of genes and does not use intensity values, GO Enrichment can be performed on an imported gene list even without any numerical values. GO Enrichment is available through the Gene Expression workflow.
If no annotation file has been specified for the gene list, GO Enrichment will use the full species transcriptome as the background genes. While suitable for next generation sequencing experiments, for microarray experiments, only the genes on the chip/array are appropriate. Please contact our technical support department for assistance with this step if needed.
Pathway Enrichment
Like GO Enrichment, Pathway Enrichment does not require numerical values, but instead operates on lists of genes - a list of significant genes vs. background genes. Consequently, Pathway Enrichment may be used with an imported list of genes even without any numerical values. The list of background genes is set to the species transcriptome by default, but can be set to a specific set of genes if the gene list has been associated with an annotation file.
Filtering
A gene list can be used to filter another spreadsheet. As an example, we will filter the results of an ANOVA on microarray data using a gene list. This will create a spreadsheet with ANOVA results for only the genes included in our gene list.
- Open the filtering gene list and target spreadsheets
- Select the target spreadsheet in the spreadsheet tree, in this example, genes are on rows in ANOVA result spreadsheet
- Select Filter from the main toolbar
- Select Filter Rows Based on a List... from Filter Rows (Figure 1)
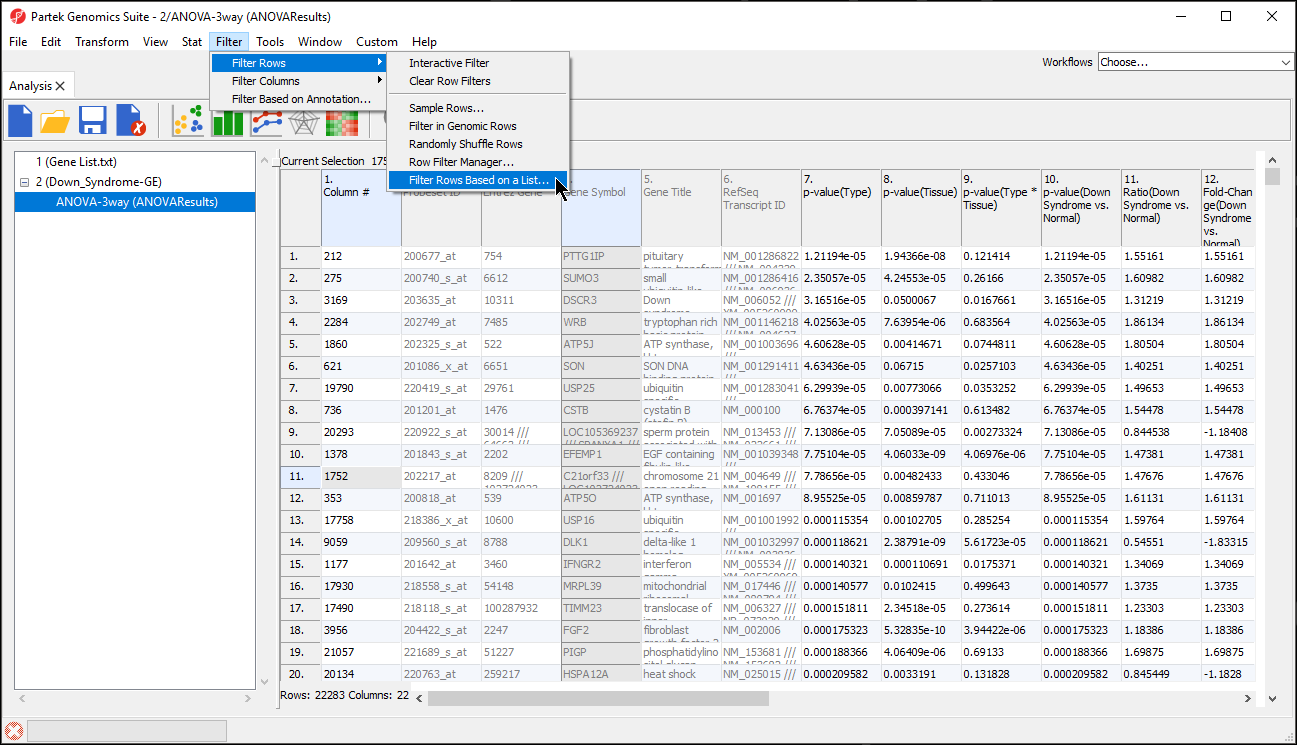
Figure 1. Filtering rows based on a list
- Select the matching column of your target spreadsheet from the Key column drop-down menu; here we have selected 4. Gene Symbol (Figure 2)
- Select the filtering gene list from the Filter based on spreadsheet drop-down menu; here we have selected 1 (Gene List.txt)
- Select the matching column of your filtering gene list from the Key column drop-down menu; here we have selected 1. Symbol
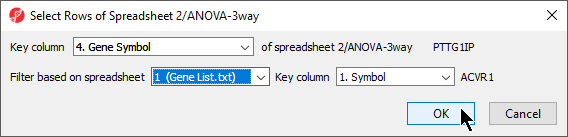
Figure 2. Selecting matching rows from filtering and target spreadsheets
- Select OK to apply the filter
The target spreadsheet will display the filtered rows (Figure 3). Note that the number of rows has gone from 22,283 prior to filtering (Figure 1) to 153 after filtering (Figure 3).
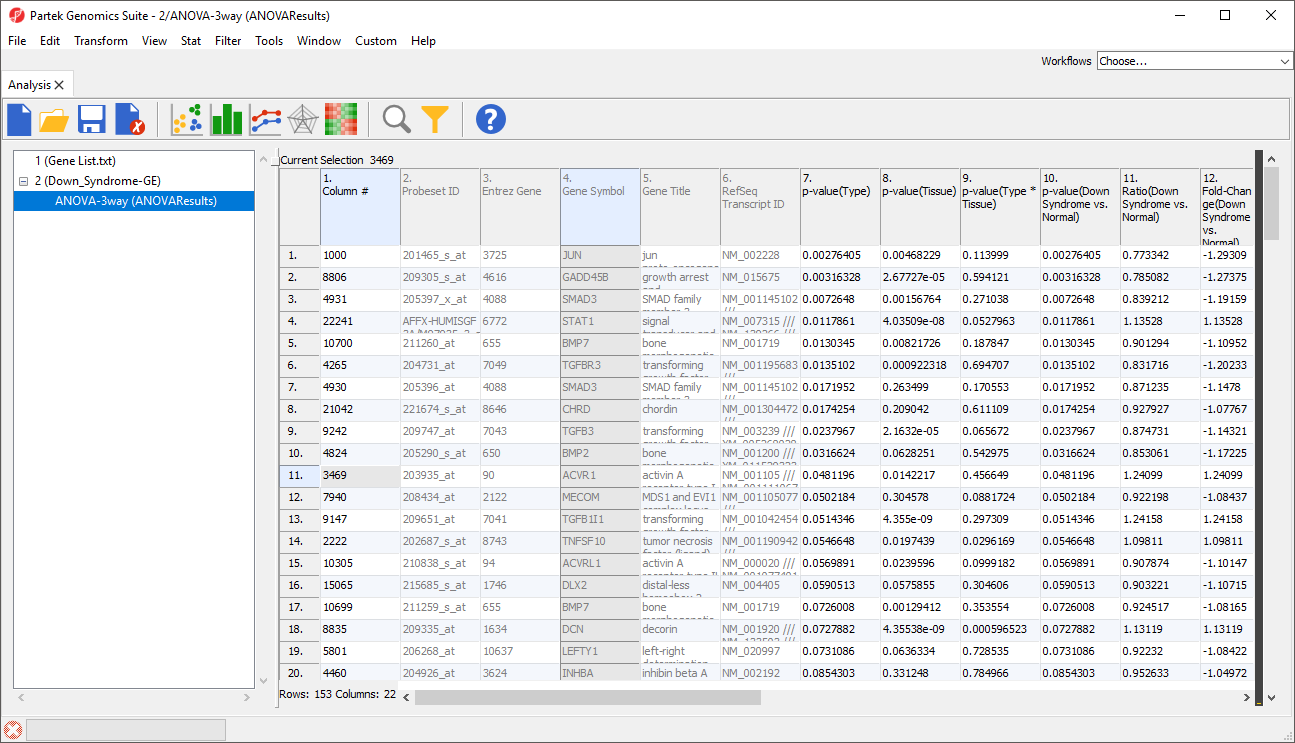
Figure 3. Filtered spreadsheet. The black bar on the right-hand side of the spreadsheet shows the fraction of filtered-out samples in black vs. the retained samples in yellow.
To use this filtered list for downstream analysis, we can save it.
- Right-click the open spreadsheet in the spreadsheet tree
- Select Clone...
- Use the Clone Spreadsheet dialog to name the new spreadsheet and choose its place in the spreadsheet hierarchy
- Select OK
The new spreadsheet will open. If you want to use the new spreadsheet again in the future, be sure to save it.
Applying Multiple Test Correction
If your imported data contains a list of p-values, you can use any of the available multiple test corrections.
- Select Stat from the main toolbar
- Select Multiple Test
- Select Multiple Test Corrections to launch a dialog with available options (Figure 4), it will add corrected p-value column(s) to the right of the selected p-value column(s)
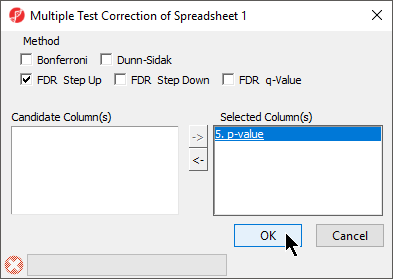
Figure 4. Options available for Multiple Test Corrections
Plotting numeric data associated with a gene list
A variety of profile plots can be used to visualize the numerical data associated with your imported gene list.
- Select View from the main toolbar
- Select any applicable option
Genome Browser
If you have imported numerical data associated with genes (like p-values or fold-changes), you can visualize these values in the Genome Browser once an annotation file is associated to the spreadsheet, and there is genomic location information in the annotation file.
- Right-click on a row header in the imported gene list spreadsheet
- Select Browse to location
If the annotations have been configured properly, you should see a Regions track for the first column of numerical data, a cytoband track, and an annotation track. You can also add another track to display a second column of numerical data.
- Select New Track
- Select Add a track from spreadsheet
- Select Next >
A new track titled Regions will be added.
- Select Regions in the track preferences panel to edit it
- Select the other numerical column in the Bar height by drop-down menu
Clustering
For a gene list with expression values on each sample, clustering can be performed. Access the clustering function through the toolbar, not from a workflow. The workflow implementations assume that the data to be clustered are found on a parent spreadsheet and the list of genes is in a child spreadsheet.
- Select Tools form the main toolbar
- Select Discover then Hierarchical Clustering
Hierarchical Clustering assumes that samples are rows and genes are columns so consider transposing your data if this is not the case. If you have only one column or row of data, cluster only on the dimension with multiple categories by deselecting either Rows or Columns from What to Cluster in the Hierarchical Clustering dialog.
Additional Assistance
If you need additional assistance, please visit our support page to submit a help ticket or find phone numbers for regional support.


| Your Rating: |
|
Results: |

|
36 | rates |
Overview
Content Tools