Page History
...
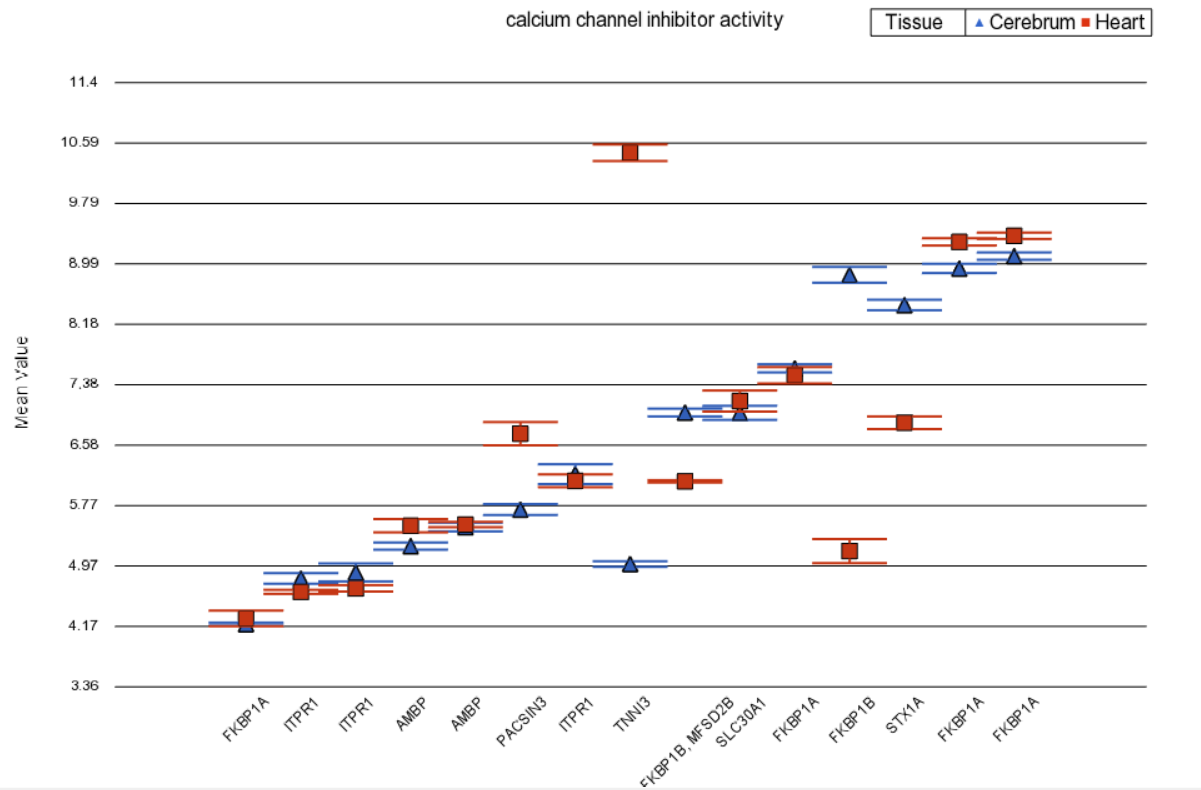
Profile plots or profiles represent each category of one of the GO ANOVA factors as a few overlapping lines. Horizontal coordinates refer to individual genes or probes in the original data. Vertical coordinates represents expression of the individual gene. Invoke this plot by right clicking on the row header of a function group of interest and choosing Profile (Orig. Data). This plot is useful as the pattern of gene expression in the group is displayed as a line. If the pattern is conserved across treatments, the lines will lie parallel, but if the gene reacts differently, the lines will follow a different pattern, maybe even cross each other.
Profile plot on Figure 2 visualizes a GO category without differential expression, but with significant disruption. Note that the gene TNNI3 is up-regulated in the heart, while STX1A is down-regulated in the heart.
| Numbered figure captions | ||||
|---|---|---|---|---|
| ||||
|
| Additional assistance |
|---|
|
| Rate Macro | ||
|---|---|---|
|
Overview
Content Tools