Page History
...
| Numbered figure captions | ||||
|---|---|---|---|---|
| ||||
|
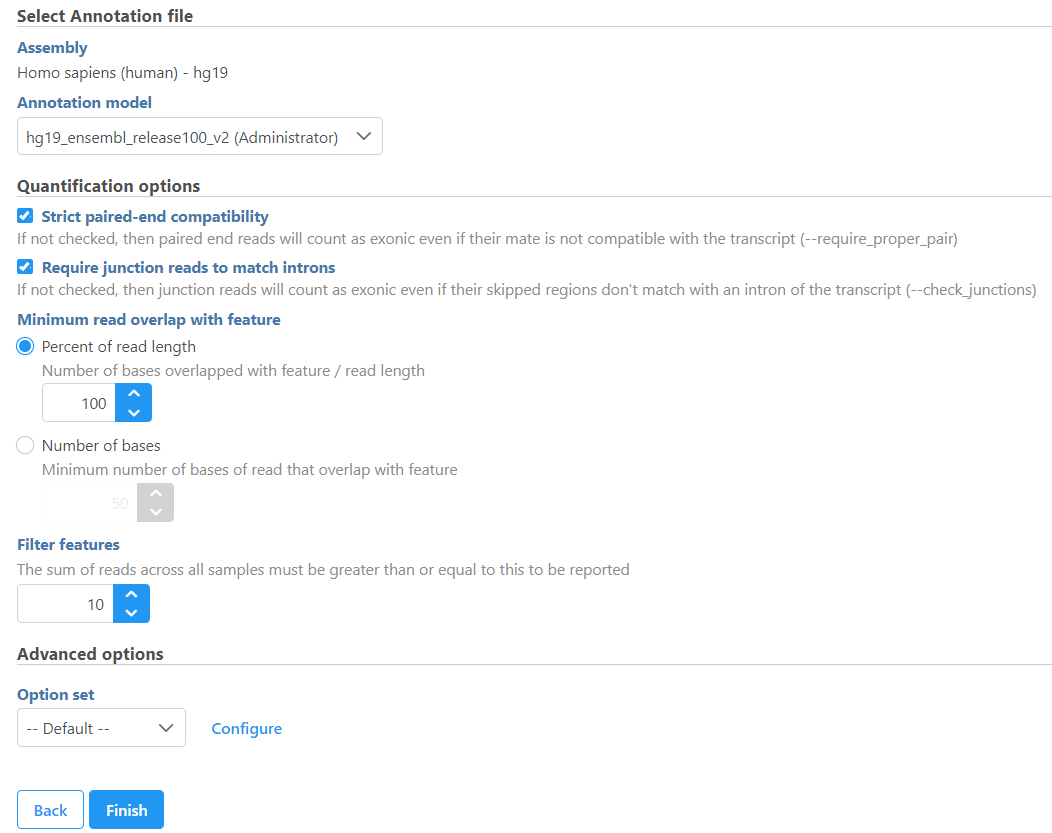
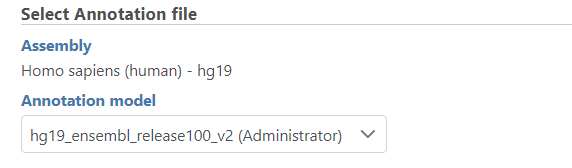
If the bam file is imported, you need to select the assembly with which the reads were aligned to, and which annotation model file you will use to quantify from the drop-down menus (Figure 2).
...
| Numbered figure captions | ||||
|---|---|---|---|---|
| ||||
|
In the Quantification options section, when the Strict paired-end compatibility check button is selected, paired end reads will be considered compatible with a transcript only if both ends are compatible with the transcript. If it is not selected, reads with only one end have alignment that is compatible with the transcript will also be counted for the transcript .
...
| Numbered figure captions | ||||
|---|---|---|---|---|
| ||||
|
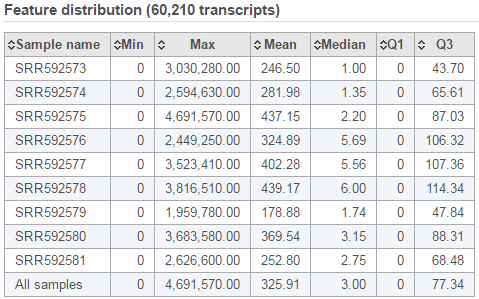
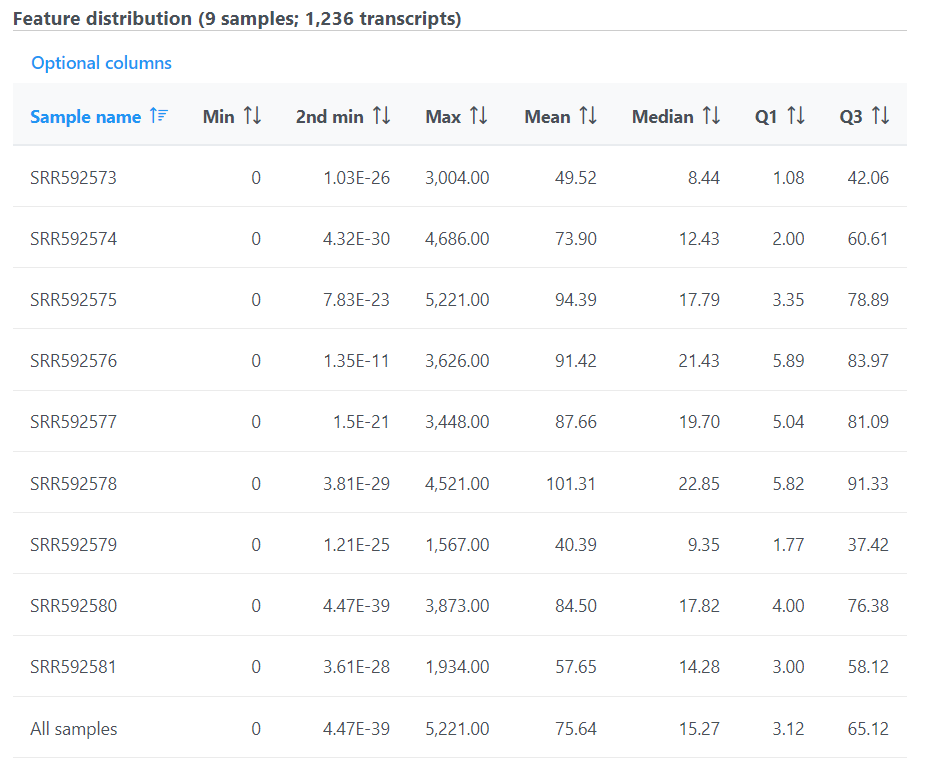
The second table contains feature distribution information on each sample and across all the samples, number of features in the annotation model is displayed on the table title (Figure 5).
...
| Numbered figure captions | ||||
|---|---|---|---|---|
| ||||
|
The bar chart displaying the distribution of raw read counts is helpful in assessing the expression level distribution within each sample. The X-axis is the read count range, Y axis is the number of features within the range, each bar is a sample. Hovering your mouse over the bar displays the following information (Figure 6):
...
In the box-whisker plot, each box is a sample on X-axis, the box represents 25th and 75th percentile, the whiskers represent 10th and 90th percentile, Y-axis represents the read feature counts, when you hover over each box, detailed sample information is displayed (Figure 8).
...
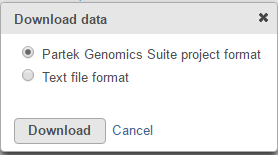
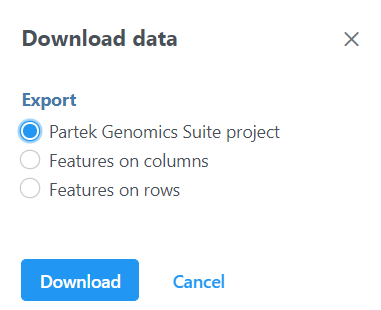
The output data node contains raw reads of each sample on each feature (gene or transcript or miRNA etc. depends on the annotation used). When click on a output data node, e.g. transcript counts data node, choose Download data on the context context sensitive menu on the right, the raw reads of transcripts can be downloaded in two three different format (Figure 10):
Partek Genomics Suite project format: it is a zip file, do not manually unzip it, you can choose File>Import>Zipped project in Partek Genomics Suite to import the zip file into PGS.
Text file Features on columns and Features on rows format: it is a .txt file, you can open the text file in any text editor or Microsoft Excel, each row is a transcript, each column is a sample. For Features on columns format, samples will be on rows. For Features on rows format, samples will be at columns.
| Numbered figure captions | ||||
|---|---|---|---|---|
| ||||
|
References
- Xing Y, Yu T, Wu YN, Roy M, Kim J, Lee C. An expectation-maximization algorithm for probabilistic reconstructions of full-length isoforms from splice graphs. Nucleic Acids Res. 2006; 34(10):3150-60.
...
Overview
Content Tools