Page History
...
- Click the counts data node
- Click the Correlation Statistics section in the toolbox
- Click Correlation analysis
- Select the factors and interactions to include in the statistical test
- Correlation
- Choose the method to use for correlation analysis (Figure 1)
| Numbered figure captions | ||||
|---|---|---|---|---|
| ||||
|
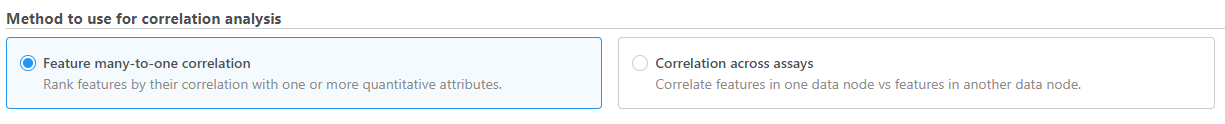
Feature many-to-one correlation
Only numeric factors are available. When multiple factors are added, the correlation analysis will perform each factor with a feature in the data node independently.
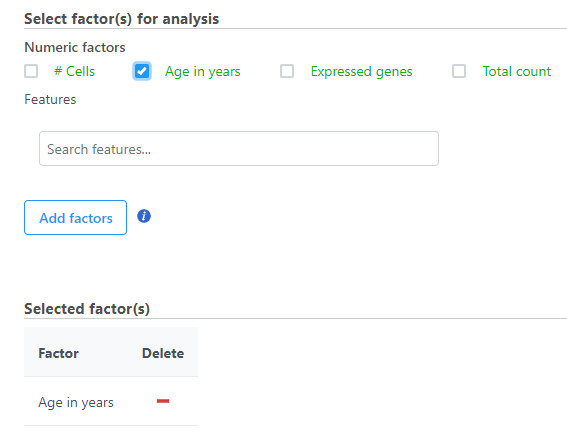
- Select the factors and interactions to include in the statistical test (Figure 2)
| Numbered figure captions | ||||
|---|---|---|---|---|
| ||||
|
- Click Next
- It is optional to apply a lowest coverage filter or configure the advanced settings
- Click Finish to run
Correlation analysis produces a Feature list a Correlation data node. The ; double-click to open the task report (Figure 13) which is similar to the ANOVA and GSA task reports and includes a table with features on rows and statistical results on columns.
...
| Numbered figure captions | ||||
|---|---|---|---|---|
| ||||
|

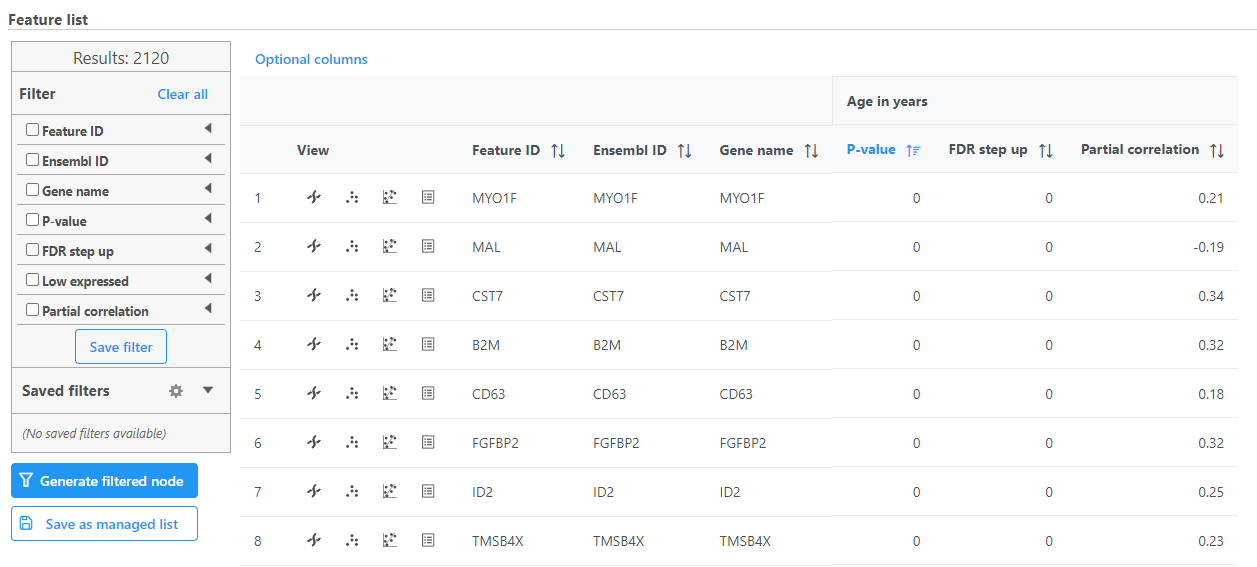
Each numeric attribute includes p-value, adjusted p-value columns (FDR step up and/or Storey q-value if included), and a partial correlation value. Each interaction will have p-value and adjusted p-value columns (FDR step up and/or Storey q-value if included).
...
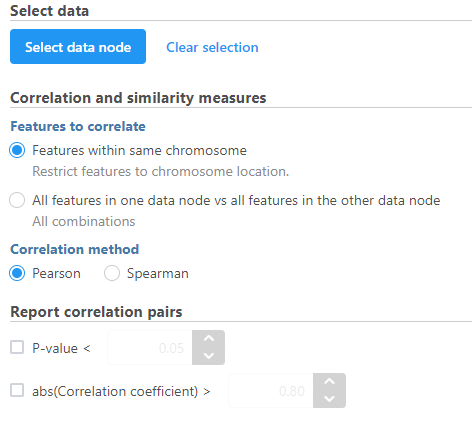
Sets the type of correlation used to calculate the correlation coefficient and p-value. Options are Pearson (linear), Spearman (rank), Kendall (tau). Default is Pearson (linear).
Correlation across assays
Correlation across assays should be used to perform correlation analysis across different modalities (e.g. ATAC-Seq enriched regions vs. RNA-Seq expression) for multiomics data analysis. This option will only be available when multiple types of data are available in the project.
- Select the data node to be compared to the node that the task has been invoked from using the Select data node button
- Modify any parameters (Figure 4)
- Click Finish
| Numbered figure captions | ||||
|---|---|---|---|---|
| ||||
|
Correlation across assays produces a Correlation pair list data node; double-click to open the list.
| Additional assistance |
|---|
| Rate Macro | ||
|---|---|---|
|
...
Overview
Content Tools