Page History
...
| Numbered figure captions | ||||
|---|---|---|---|---|
| ||||
|
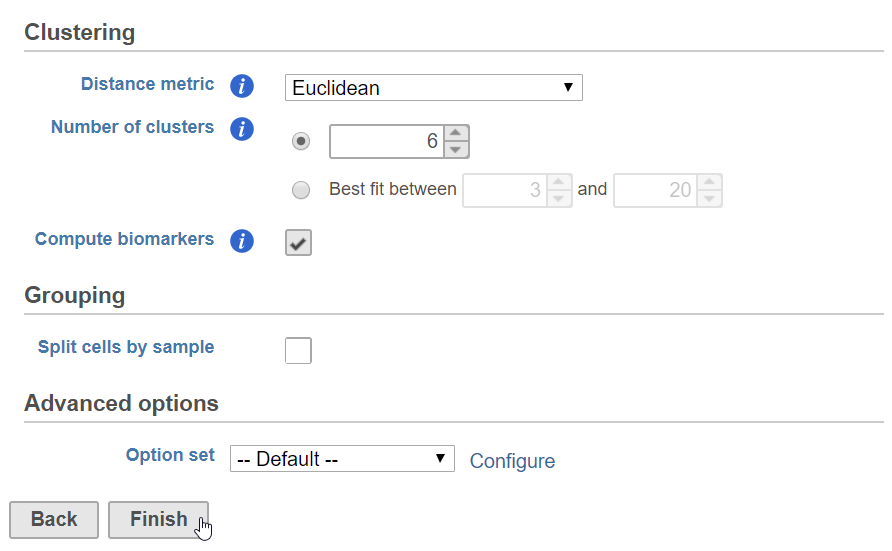
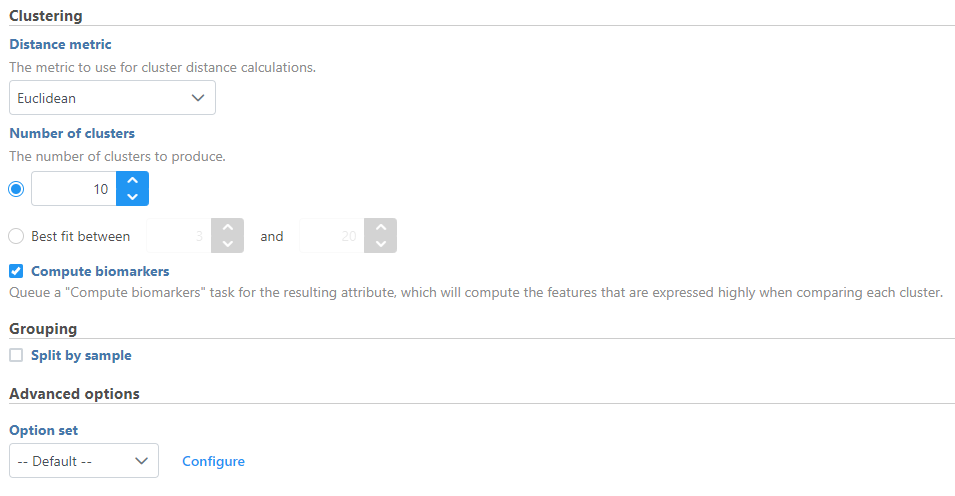
K-means clustering produces a Clustering result data node. The task report lists the cluster statistics and, if Compute cluster biomarkers was enabled, top marker features per cluster (Figure 2). If clustering was run with Split cells by sample enabled on a single cell counts data node, the cluster results table displays the number of clusters found for each sample and clicking the sample name opens the sample-level report.
...
Overview
Content Tools