Page History
...
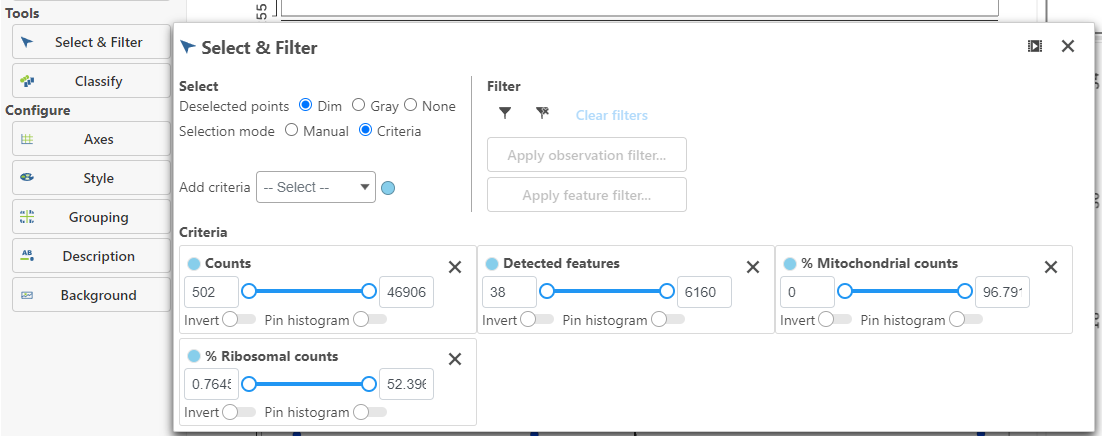
High-quality cells can be selected using the Selection card on the right Select & Filter, which is pre-loaded with three the selection rulescriteria, one for each quality metric (Figure 5).
...
| Numbered figure captions | ||||
|---|---|---|---|---|
| ||||
|

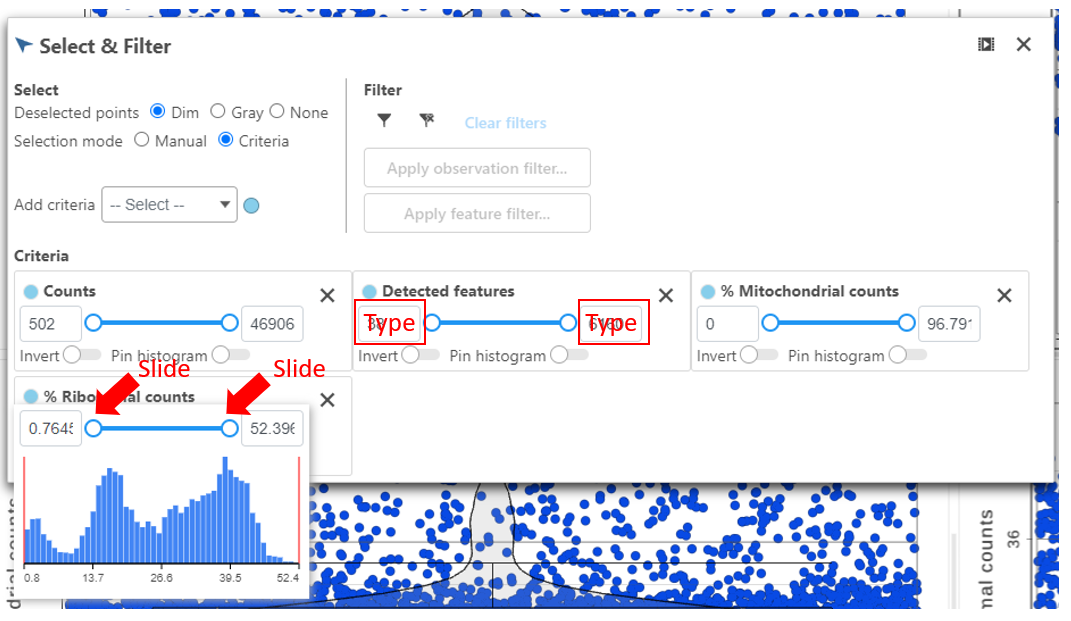
Hovering the mouse over one of the selection rules criteria reveals a histogram showing you the frequency distribution of the respective quality metric. The minimum and maximum thresholds can be adjusted by clicking and dragging the sliders sliders or by typing directly into the text boxes for each selection criteria (Figure 6).
| Numbered figure captions | ||||
|---|---|---|---|---|
| ||||
|

Alternatively, Pin histogram to view all of the thresholds can be set by typing directly into the text boxes in each selection rule distributions at one time to determine thresholds with ease (Figure 7).
| Numbered figure captions | ||||||||
|---|---|---|---|---|---|---|---|---|
|
| |||||||
|


Adjusting the selection criteria will select and deselect cells in all three plots simultaneously. Depending on your settings, the deselected points will either be dimmed or gray. The filters are additive. Combining multiple filters will include the intersection of the three filters. The number of cells selected is shown in the figure legend of each plot (Figure 8).
...
Overview
Content Tools