Page History
...
The box whisker and sample histogram plots are helpful for understanding the expression level distribution across samples. This may indicate that normalization between samples might be needed prior to downstream analysis. Note that all four visualizations are disabled for results with more than 30 samples.
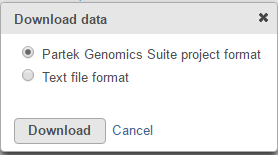
The output data node contains raw reads of each sample on each feature (gene or transcript or miRNA etc.depends on the annotation used). When click on a output data node, e.g. transcript counts data node, choose Download data on the context sensitive menu on the right, the raw reads of transcripts can be downloaded in two different format (Figure 10):
Partek Genomics Suite project format: it is a zip file, do not manually unzip it, you can choose File>Import>Zipped project in Partek Genomics Suite to import the zip file into PGS.
Text file format: it is a .txt file, you can open the text file in any text editor or Microsoft Excel, each row is a transcript, each column is a sample.
| Numbered figure captions | ||||
|---|---|---|---|---|
| ||||
|
Quantify to transcriptome (Cufflinks)
...
The Cufflinks task has three options that can be configured (Figure 1011):
| Numbered figure captions | ||||
|---|---|---|---|---|
| ||||
...
There are two parameters in Quantify to reference (Figure 1112):
| Numbered figure captions | ||||
|---|---|---|---|---|
| ||||
...
Overview
Content Tools