Page History
...
| Numbered figure captions | ||||
|---|---|---|---|---|
| ||||
|
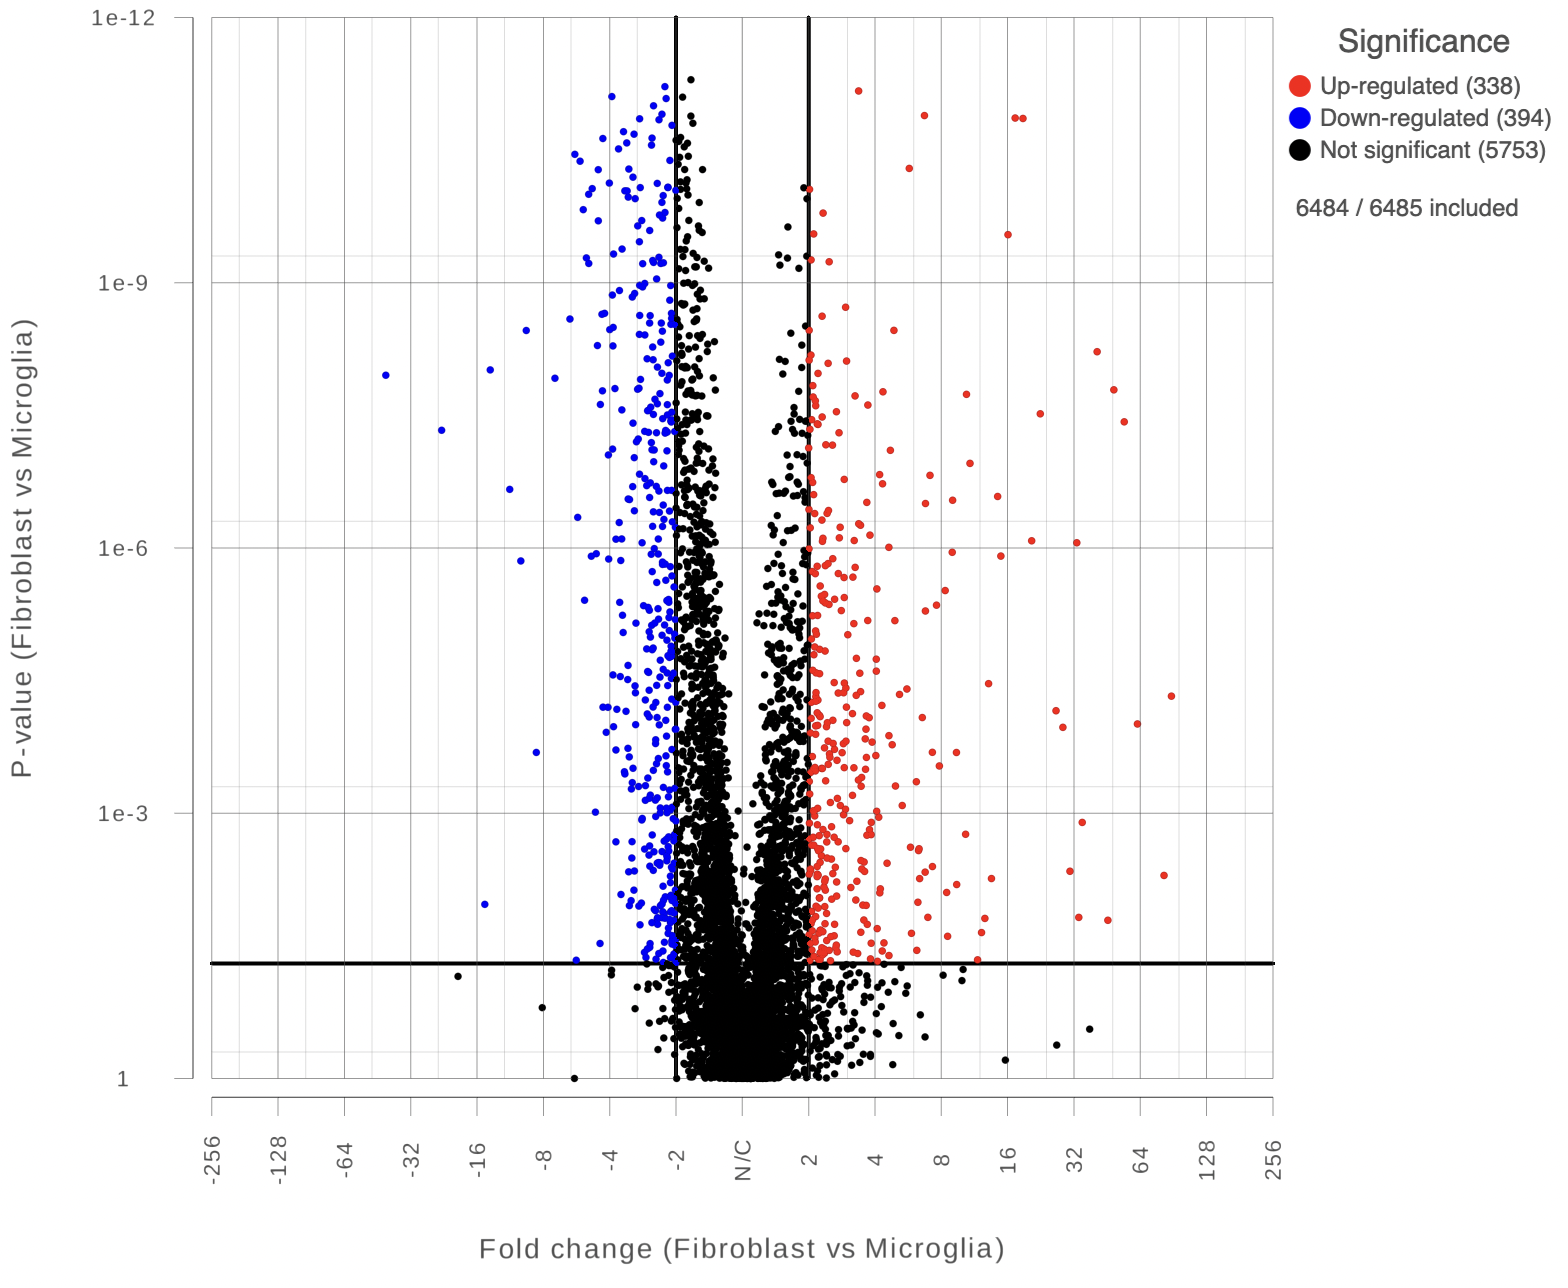
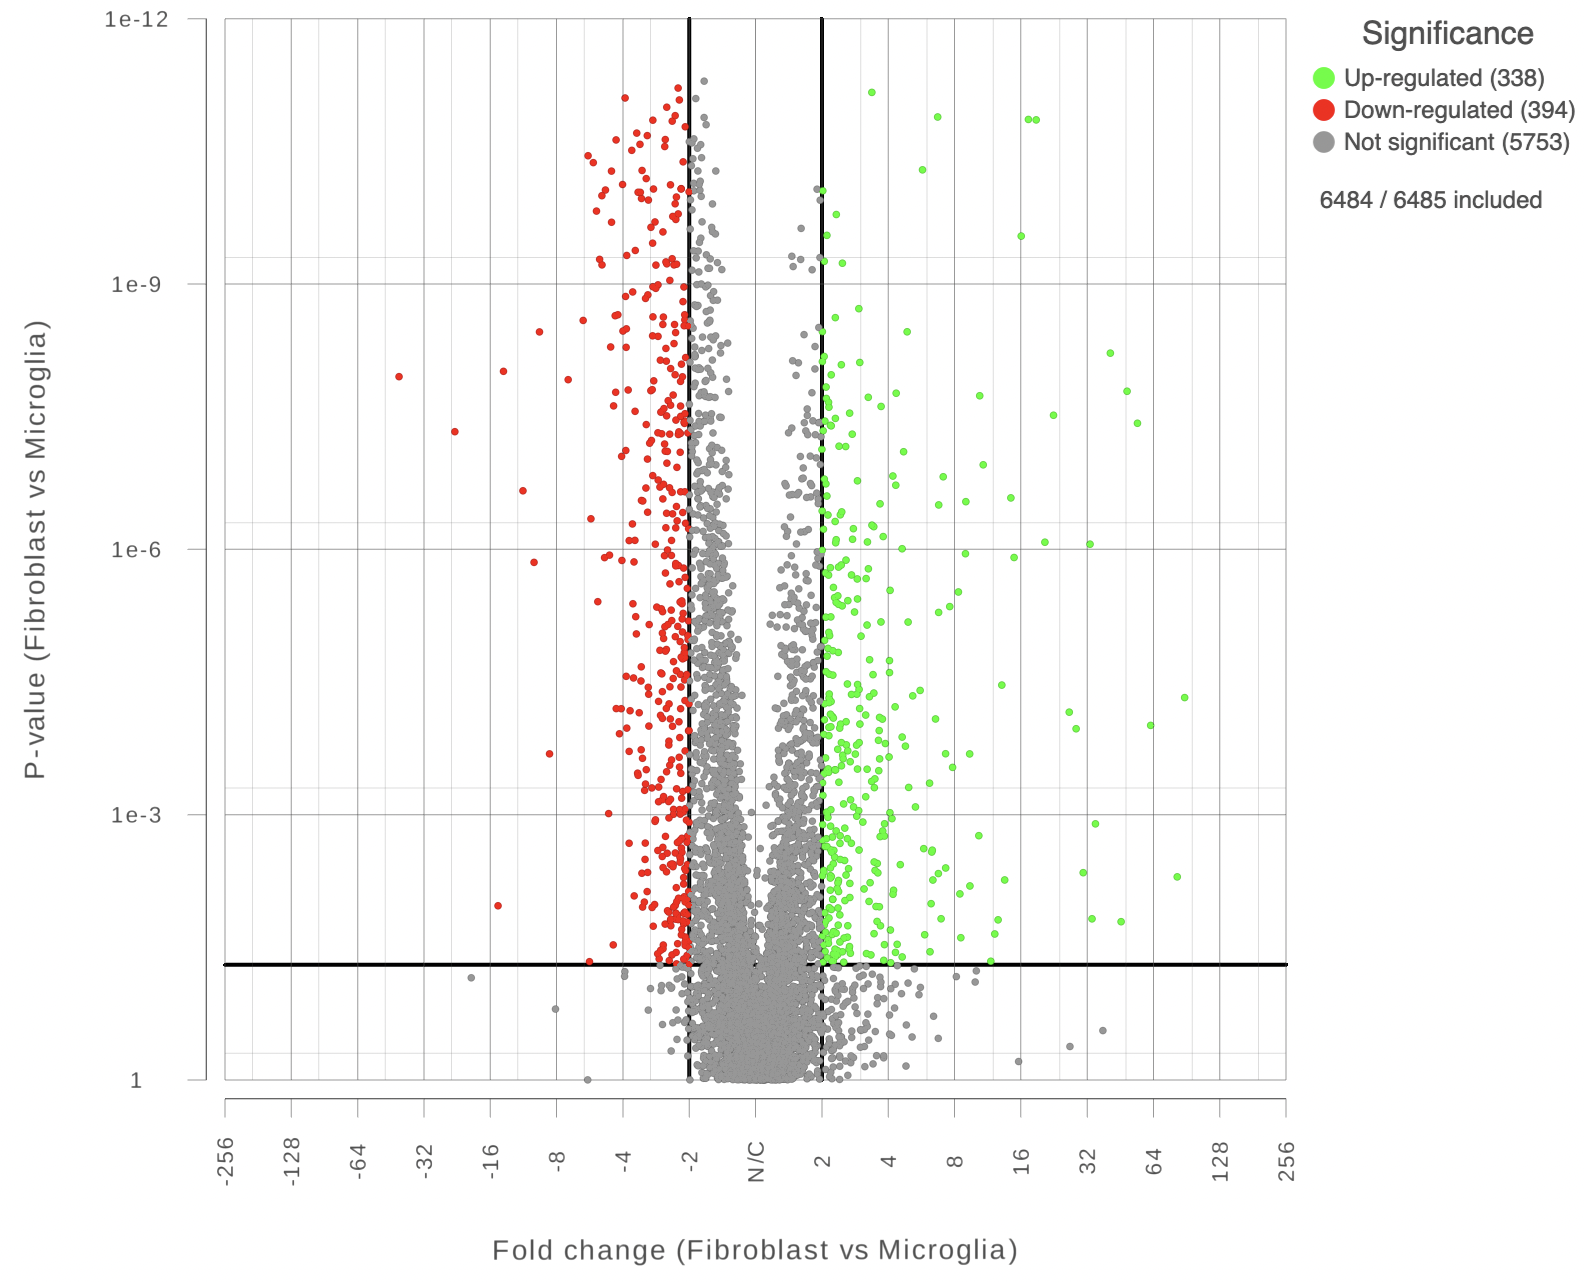
The Axes and Statistics menus allow to customize which data sources will be used for the axes as well as annotations, limits and significance thresholds for the plot (Figure 3).
...
| Numbered figure captions | ||||
|---|---|---|---|---|
| ||||
|
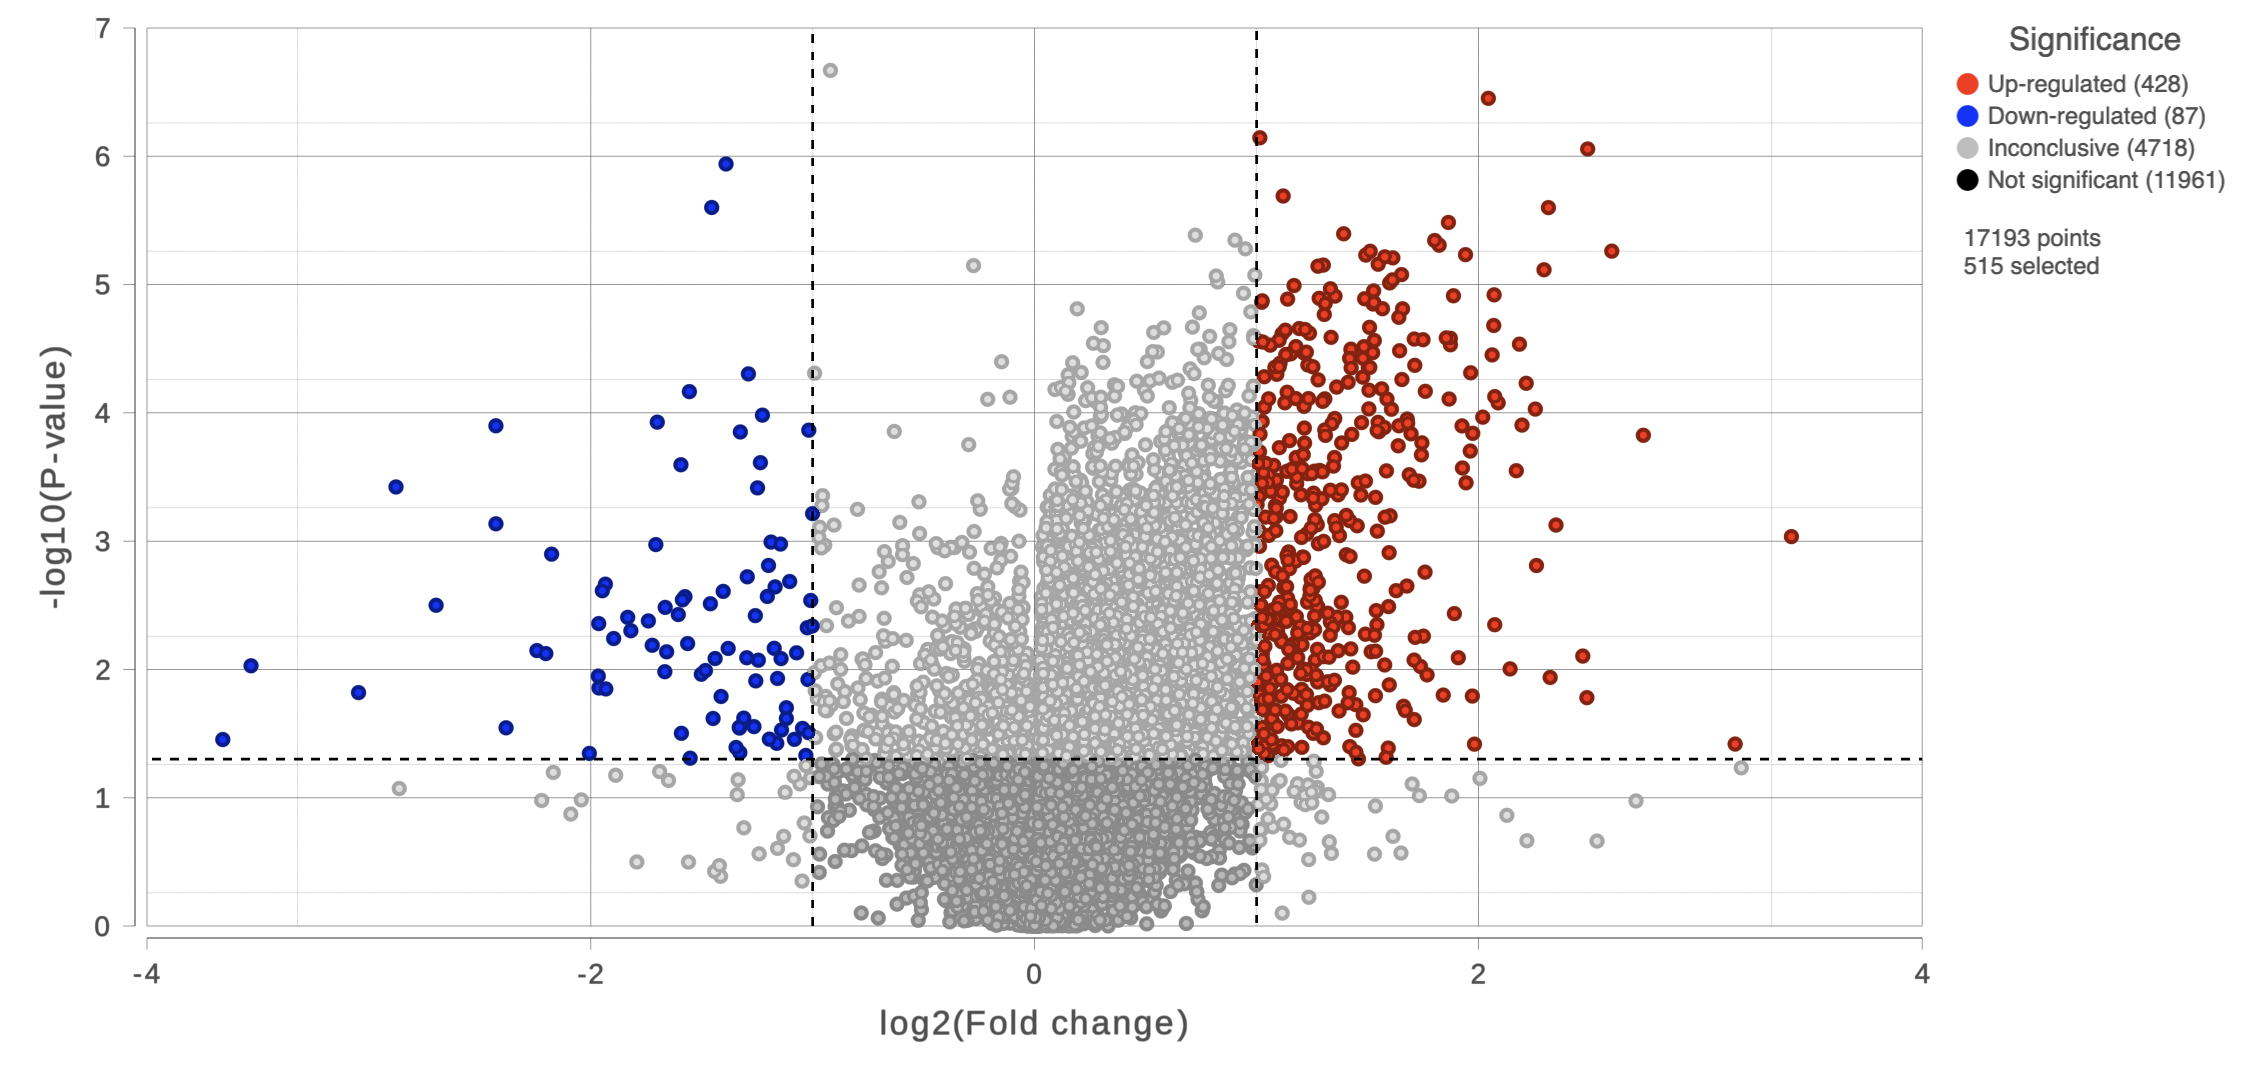
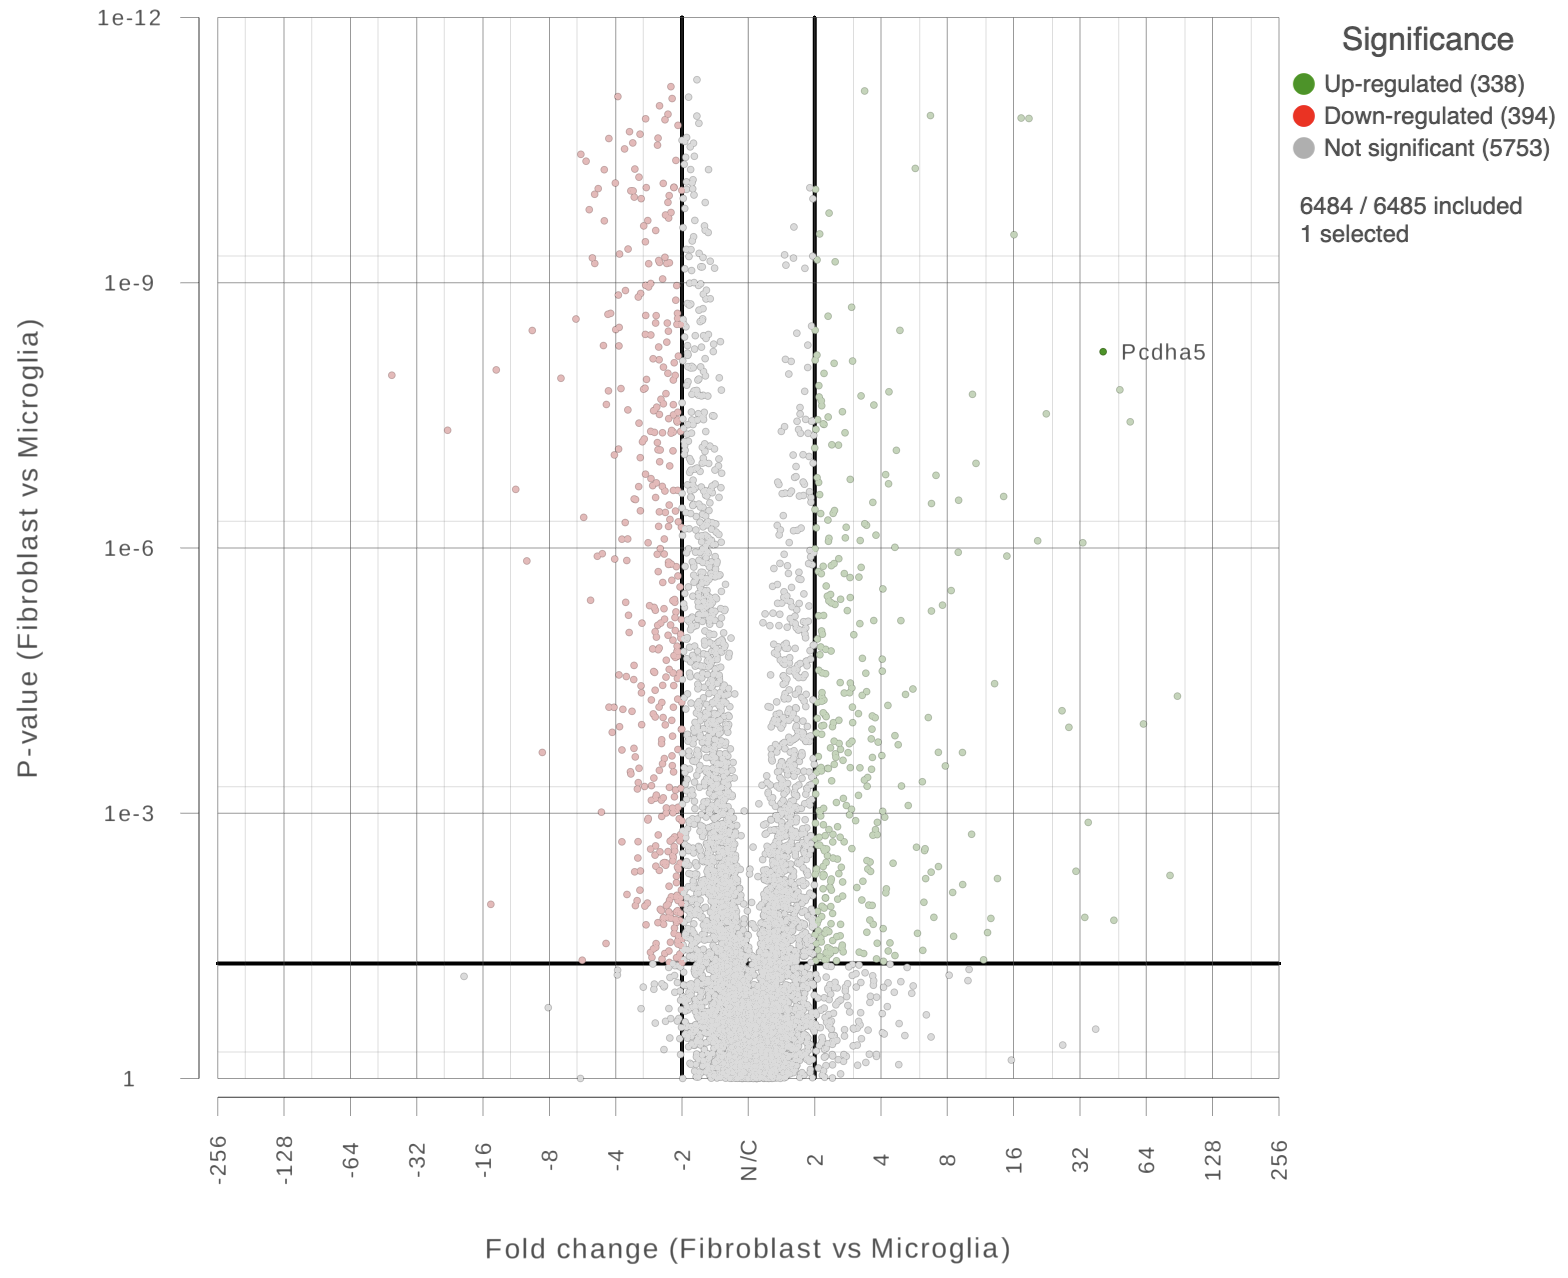
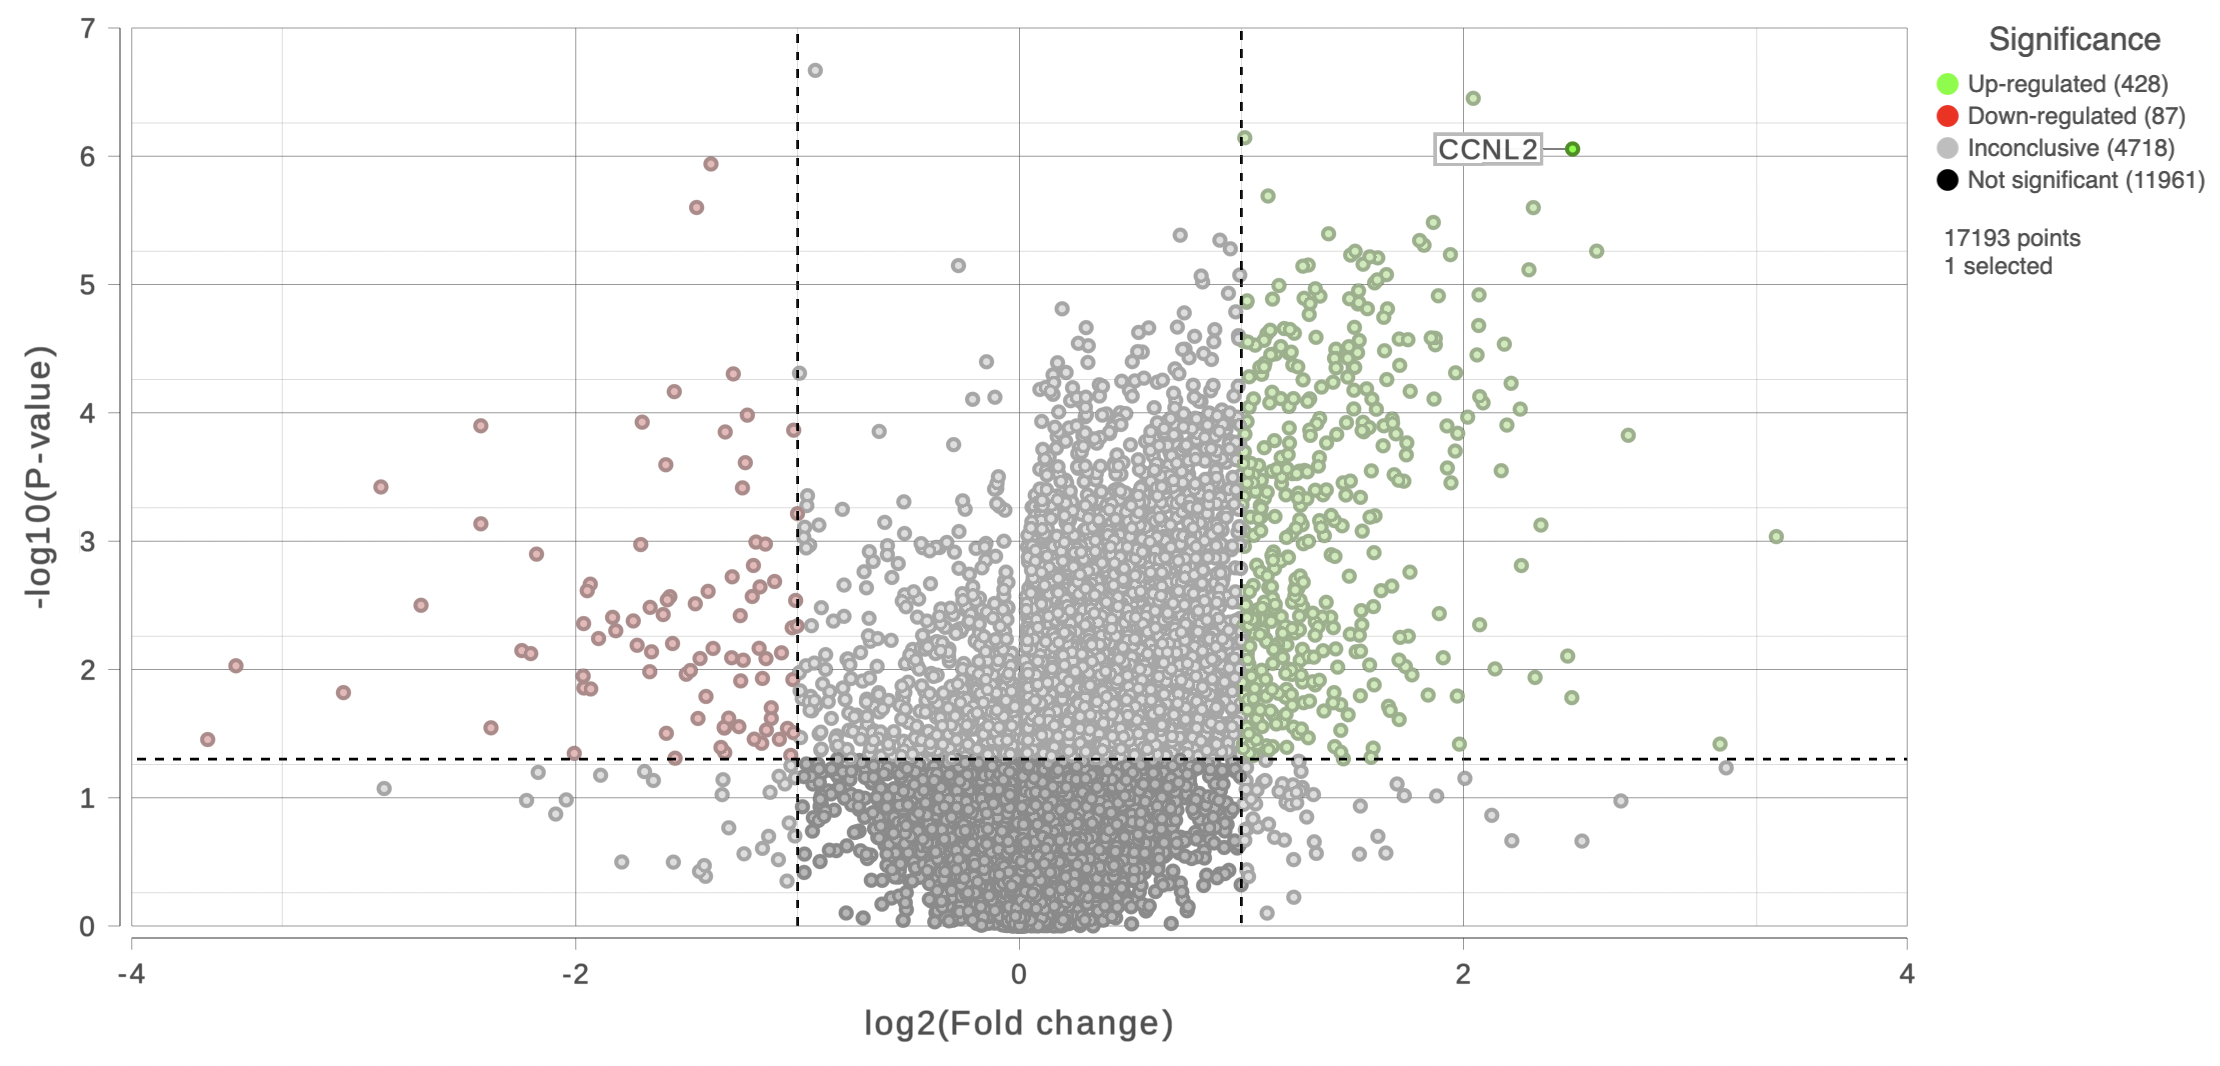
You can also highlight and label any of the genes in the plot (Figure 5).
...
| Numbered figure captions | ||||
|---|---|---|---|---|
| ||||
|
ghjkl
Click the Save image button ![]() to save a PNG or SVG image to your computer.
to save a PNG or SVG image to your computer.
...
Overview
Content Tools