Page History
...
| Numbered figure captions | ||||
|---|---|---|---|---|
| ||||
|
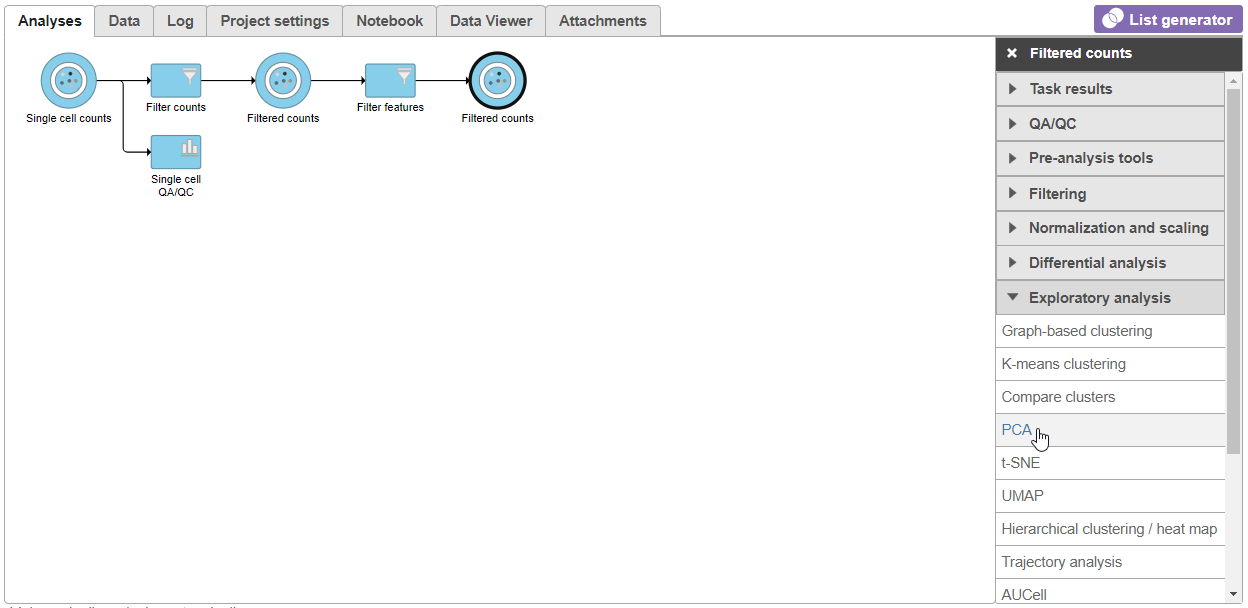
- Click Finish to run PCA with default settings (Figure 2)
...
| Numbered figure captions | ||||
|---|---|---|---|---|
| ||||
|
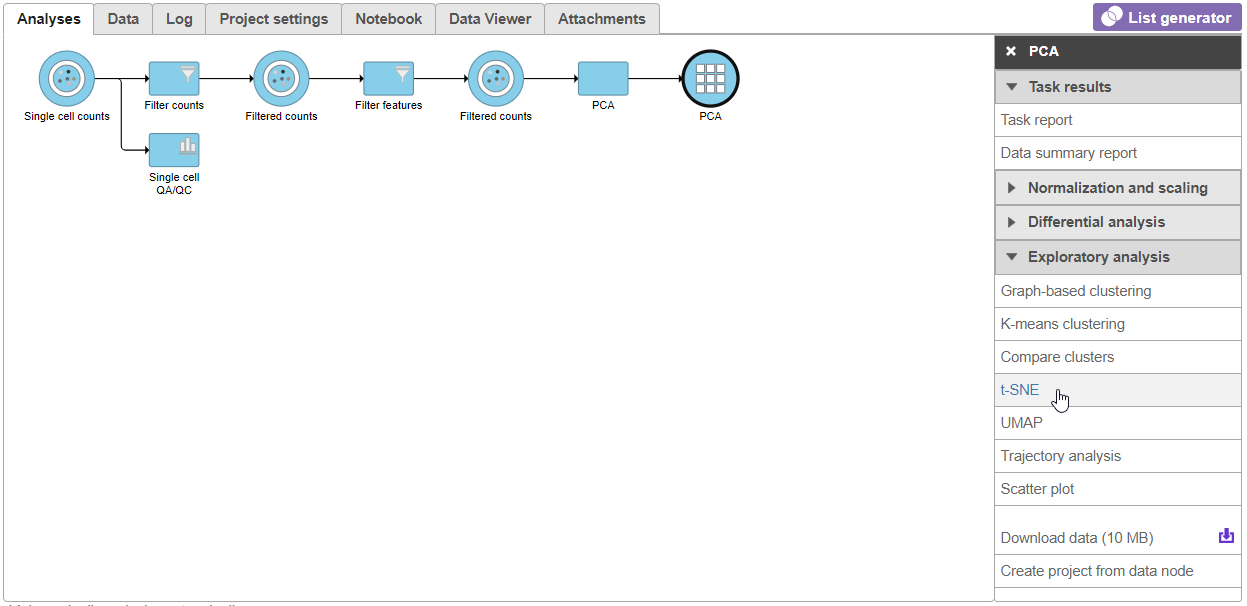
- Click Finish from the t-SNE dialog to run t-SNE with the default settings (Figure 4)
...
| Numbered figure captions | ||||
|---|---|---|---|---|
| ||||
|
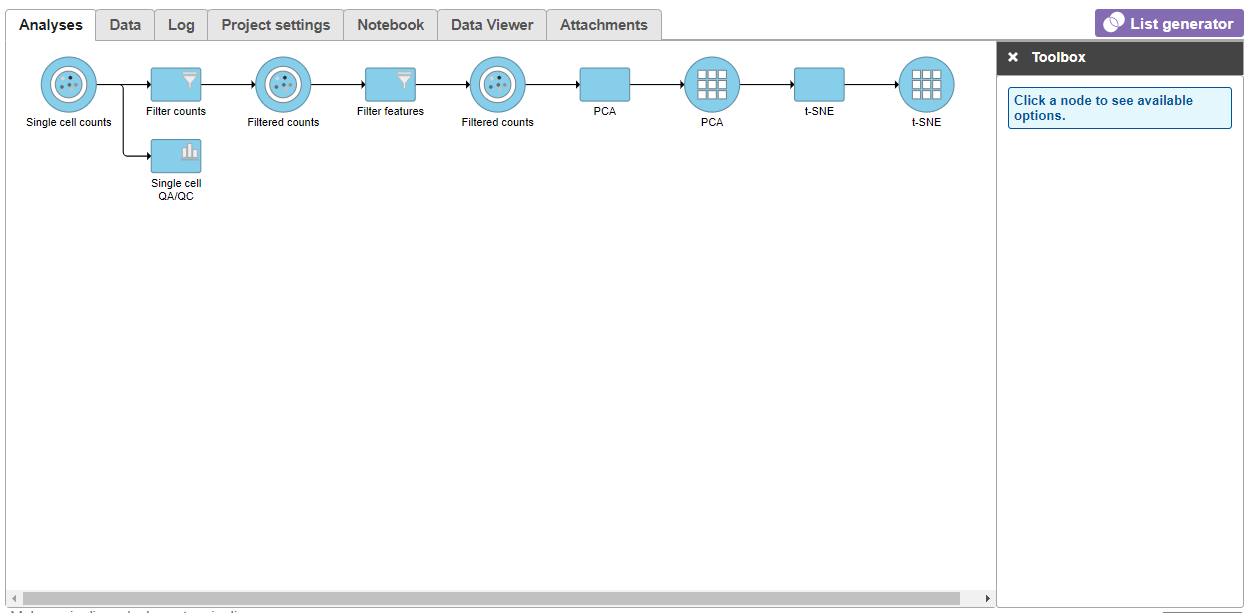
Once the t-SNE task has completed, we can view the t-SNE plots
...
| Numbered figure captions | ||||
|---|---|---|---|---|
| ||||
|
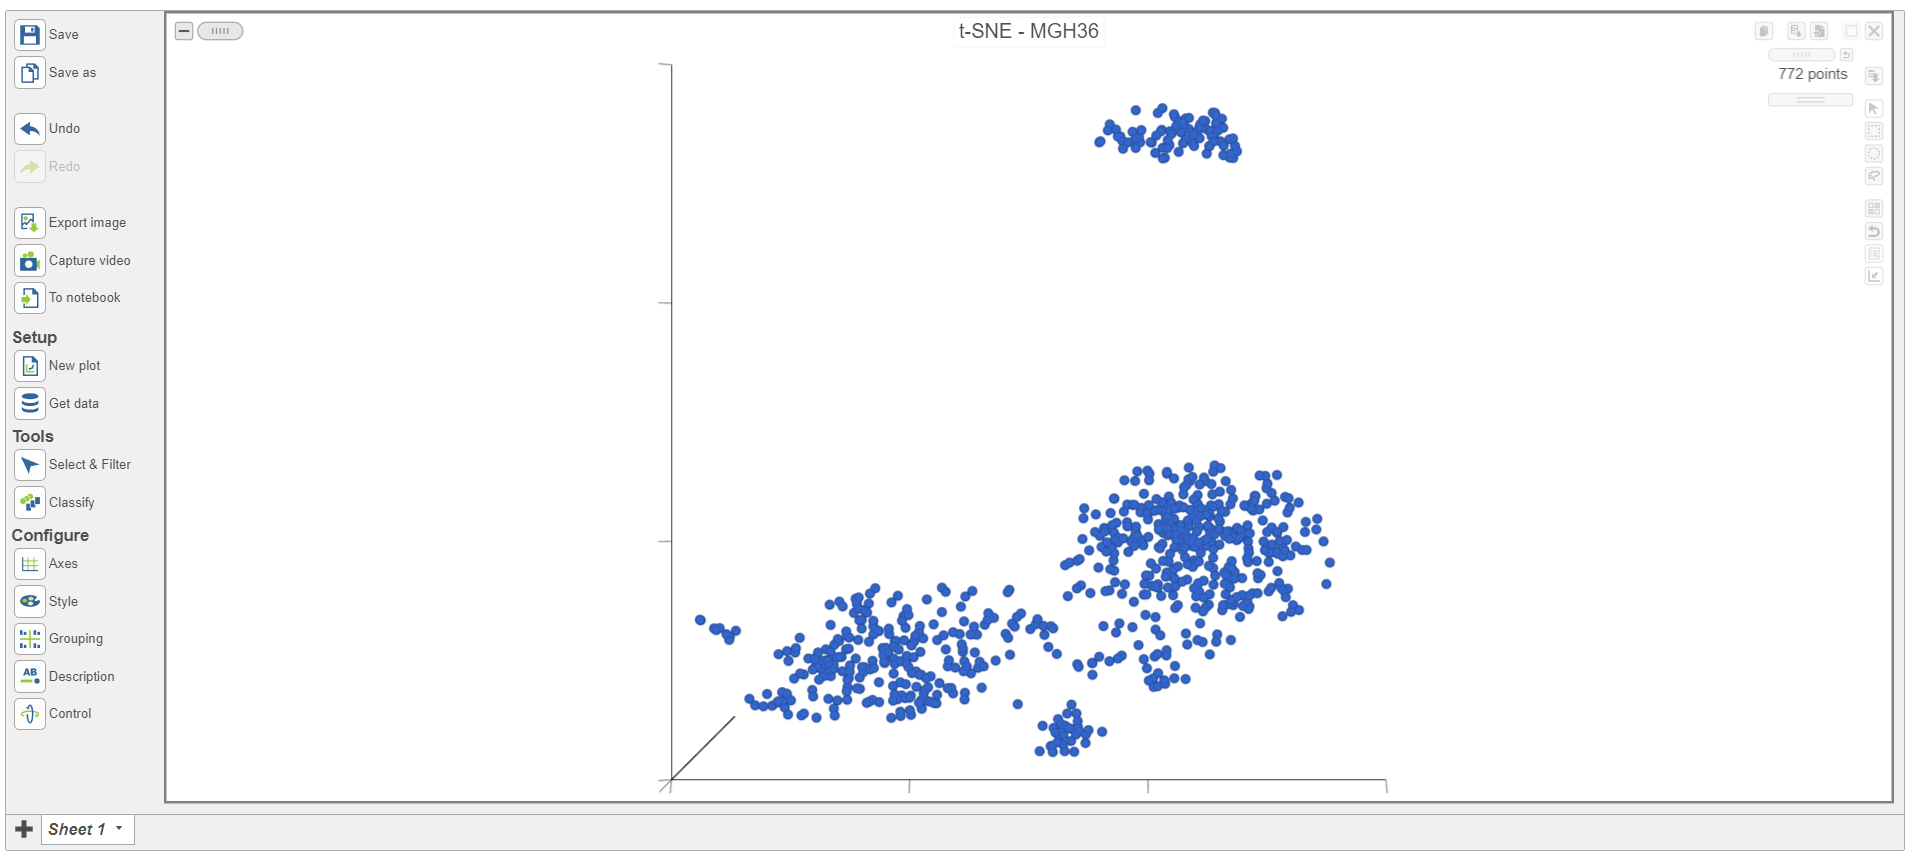
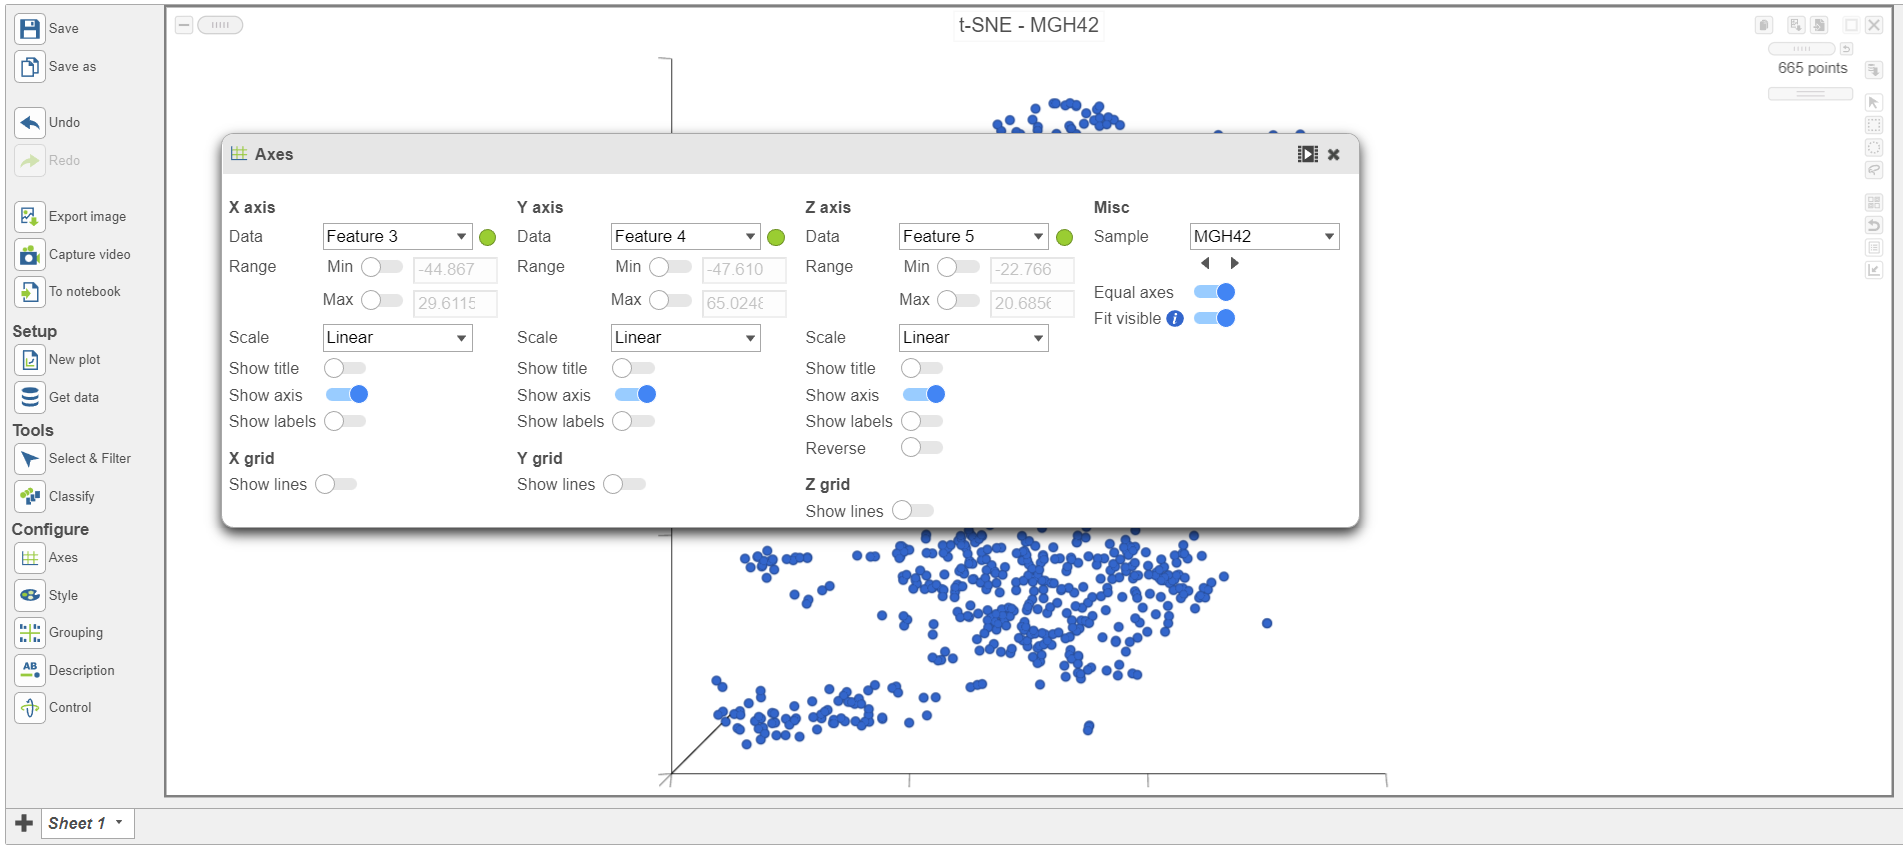
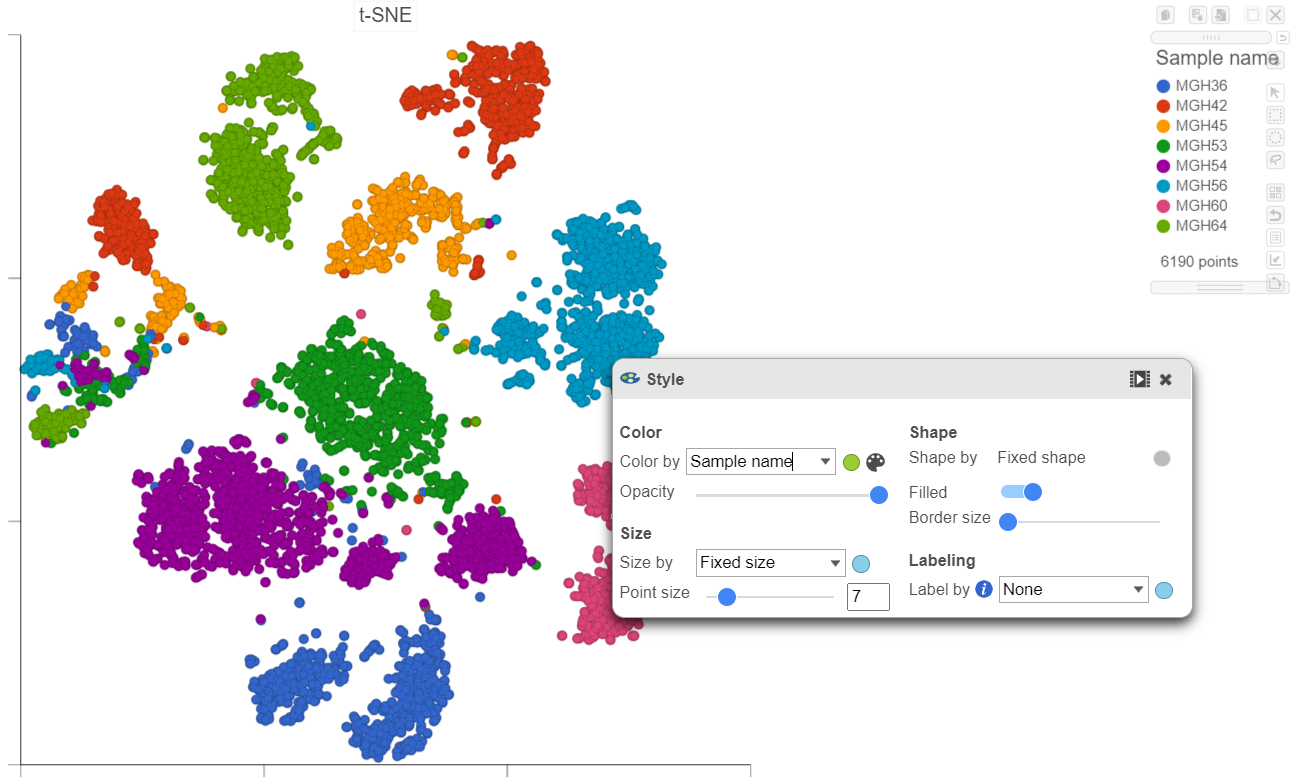
The t-SNE plot is in 3D by default. To change the default, click your avatar in the top right > Settings > My Preferences and edit your graphics preferences and change the default scatter plot format from 3D to 2D.
...
| Numbered figure captions | ||||
|---|---|---|---|---|
| ||||
|
The goal of this analysis is to compare malignant cells from two different glioma subtypes, astrocytoma and oligodendroglioma. To do this, we need to identify the malignant cells we want to include and which cells are the normal cells we want to exclude.
...
| Numbered figure captions | ||||
|---|---|---|---|---|
| ||||
|
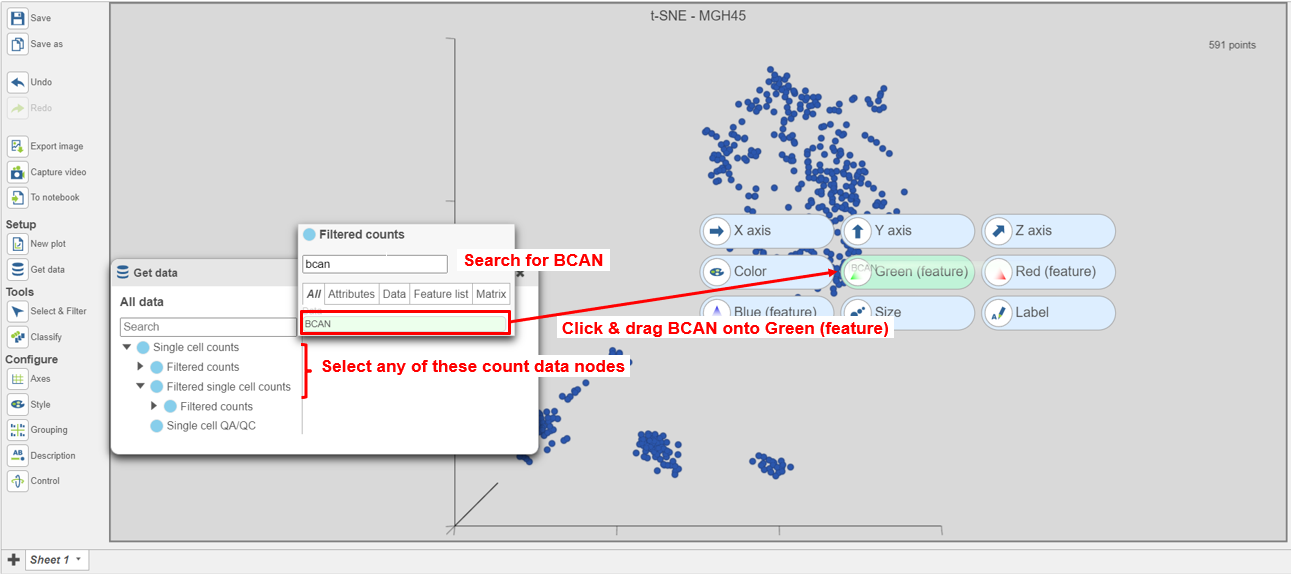
The cells will be colored from black to green based on their expression level of BCAN, with cells expressing higher levels more green (Figure 9). BCAN is highly expressed in glioma cells.
...
| Numbered figure captions | ||||
|---|---|---|---|---|
| ||||
|
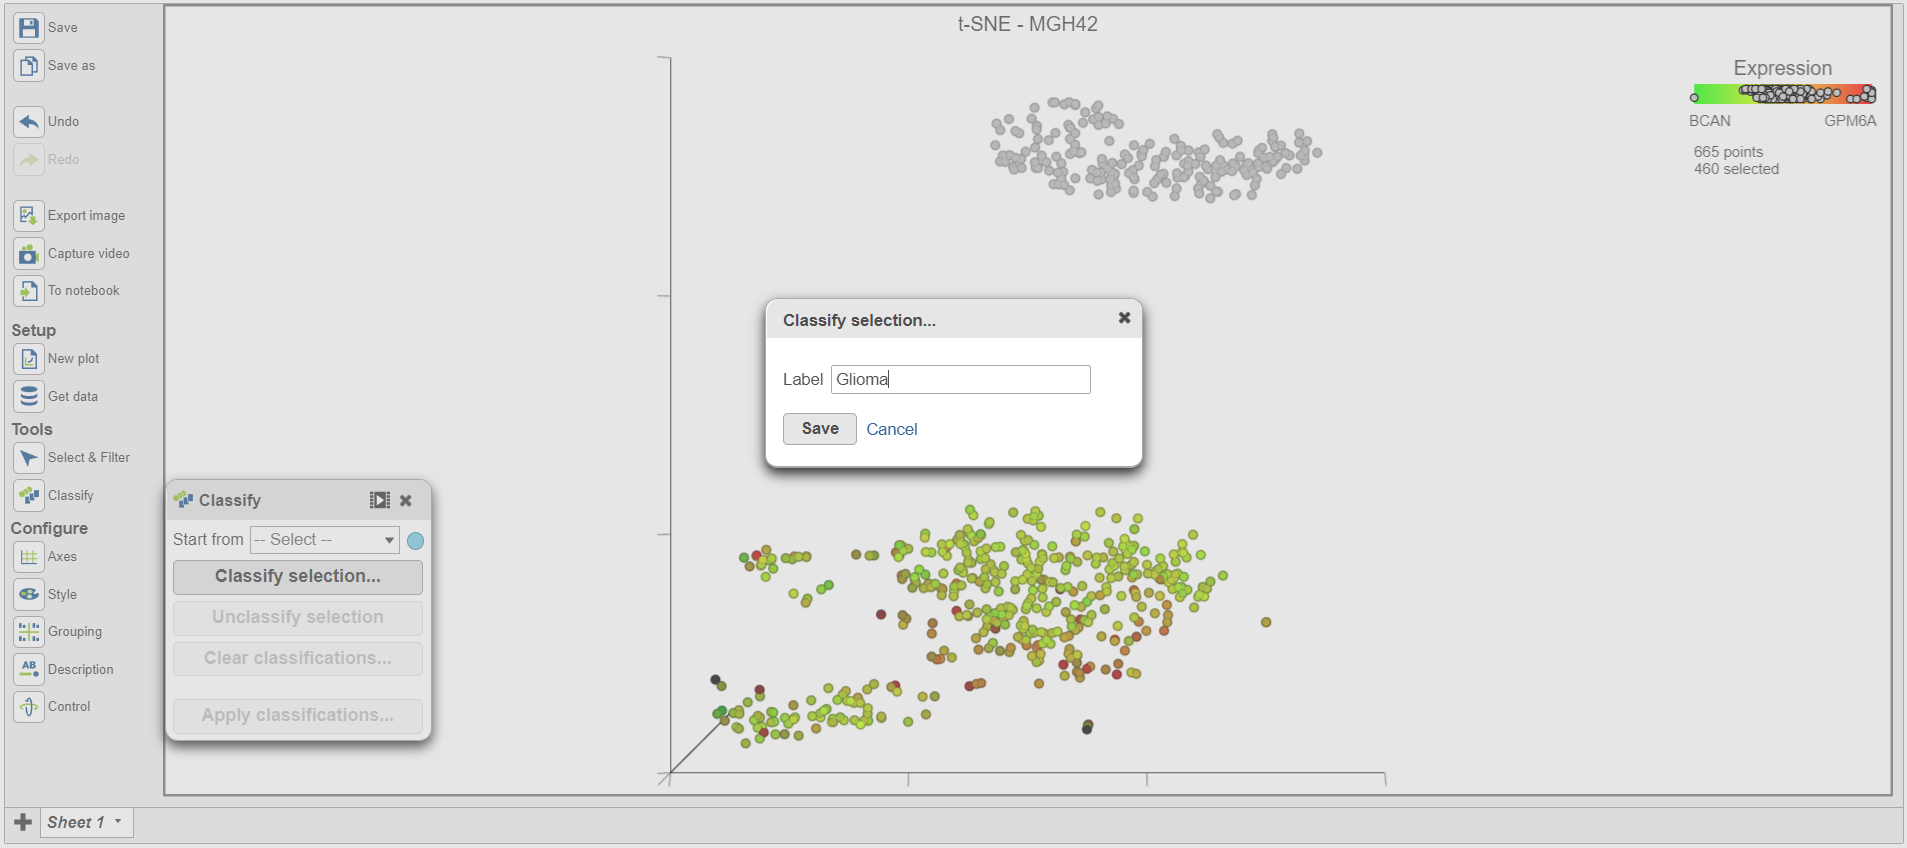
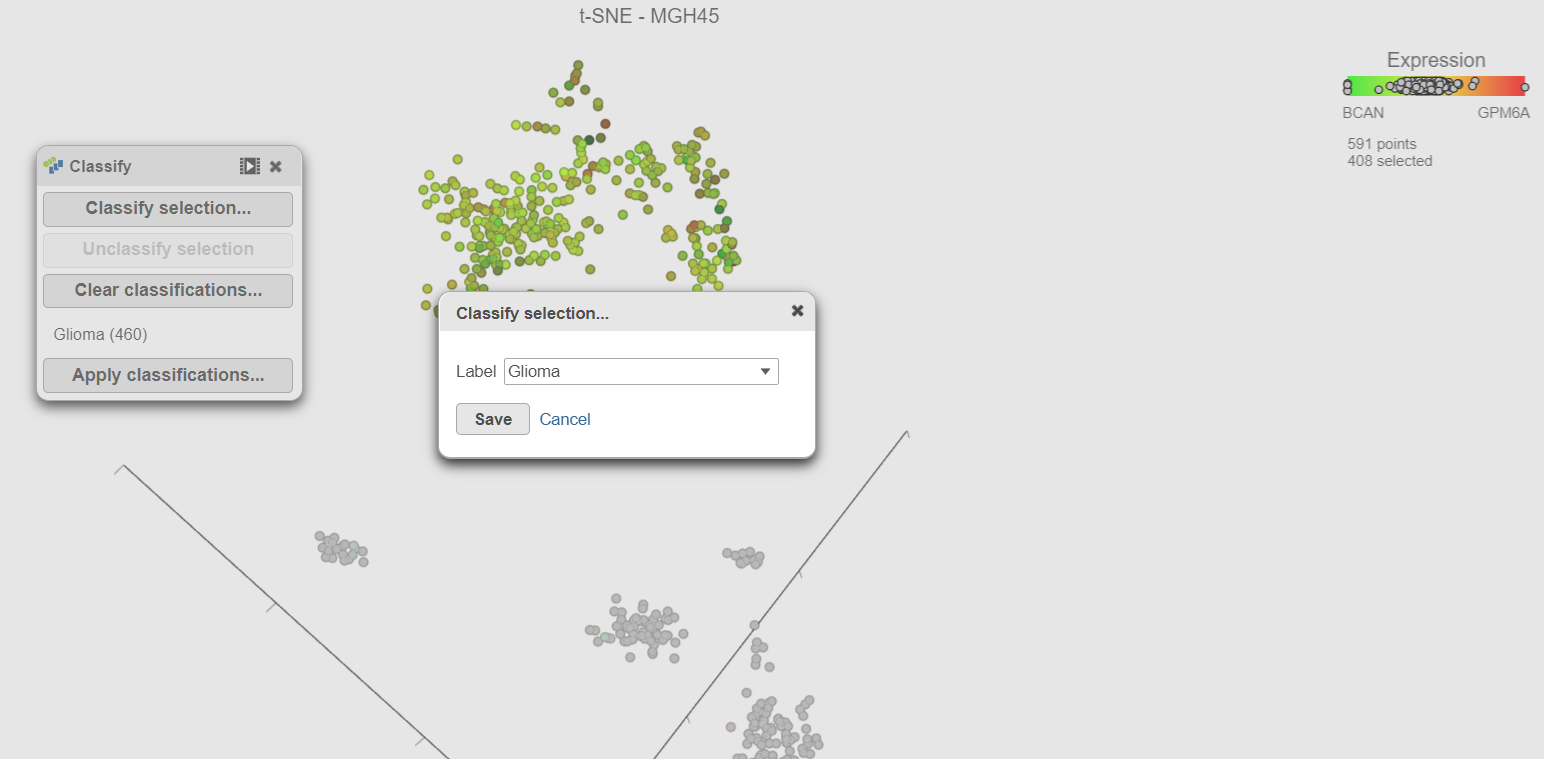
Once cells have been classified, the classification is added to Classify. The number of cells belonging to the classification is listed. In MGH42, there are 460 glioma cells (Figure 15).
...
| Numbered figure captions | ||||
|---|---|---|---|---|
| ||||
|
- Select Classify selection in the Classify icon
- Type Glioma or select Glioma from the drop-down list (Figure 17)
- Click Save
...
| Numbered figure captions | ||||
|---|---|---|---|---|
| ||||
|
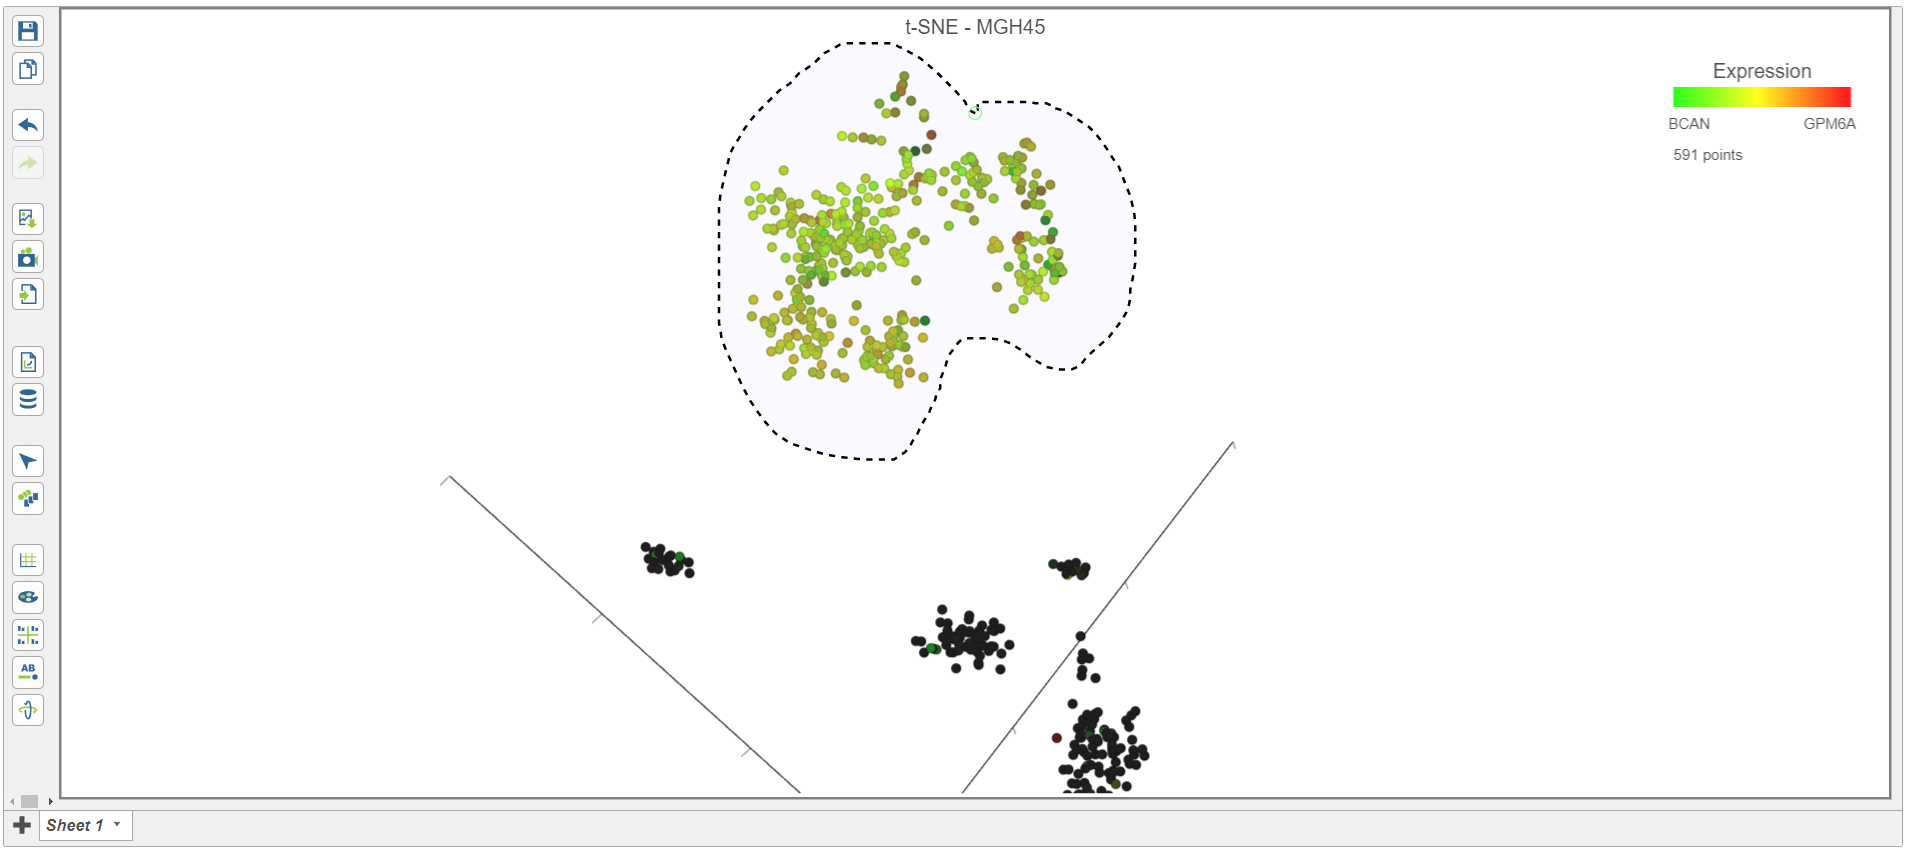
- Repeat these steps for each of the 6 remaining samples. Remember to go back to the first sample (MGH36) to classify the glioma cells in that samples too.
...
| Numbered figure captions | ||||
|---|---|---|---|---|
| ||||
|
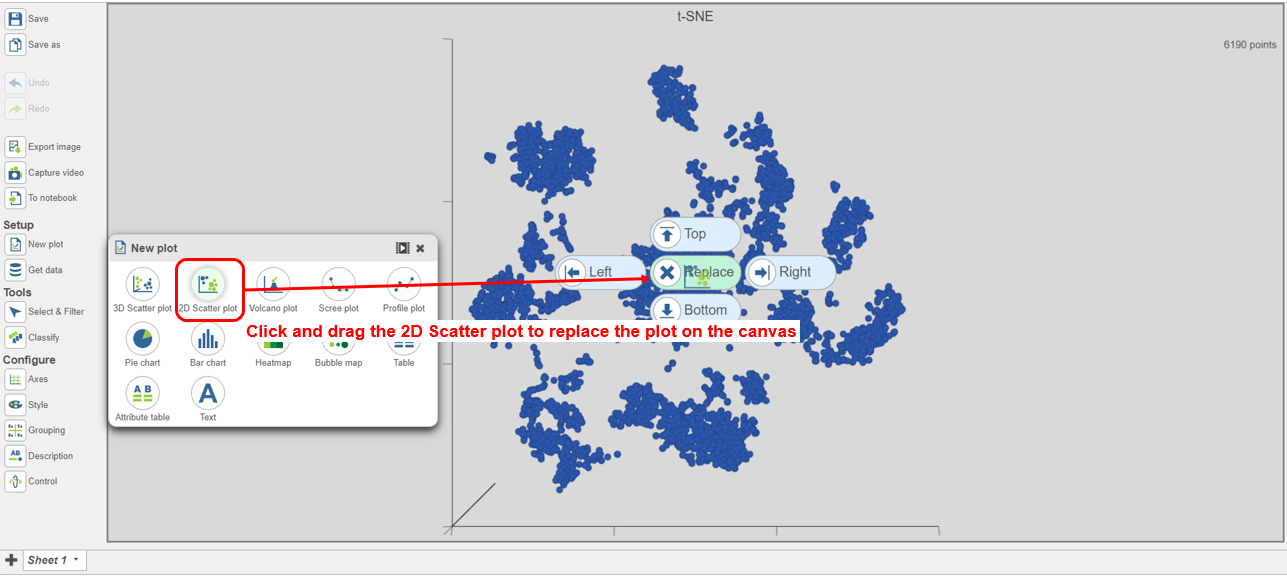
- Search for and select green t-SNE data node (Figure 25)
...
| Numbered figure captions | ||||
|---|---|---|---|---|
| ||||
|
Using marker genes, BCAN (glioma), CD14 (microglia), and MAG (oligodendrocytes), we can assess whether these multi-sample clusters belong to our known cell types.
...
Overview
Content Tools