Page History
...
| Numbered figure captions | ||||
|---|---|---|---|---|
| ||||
|
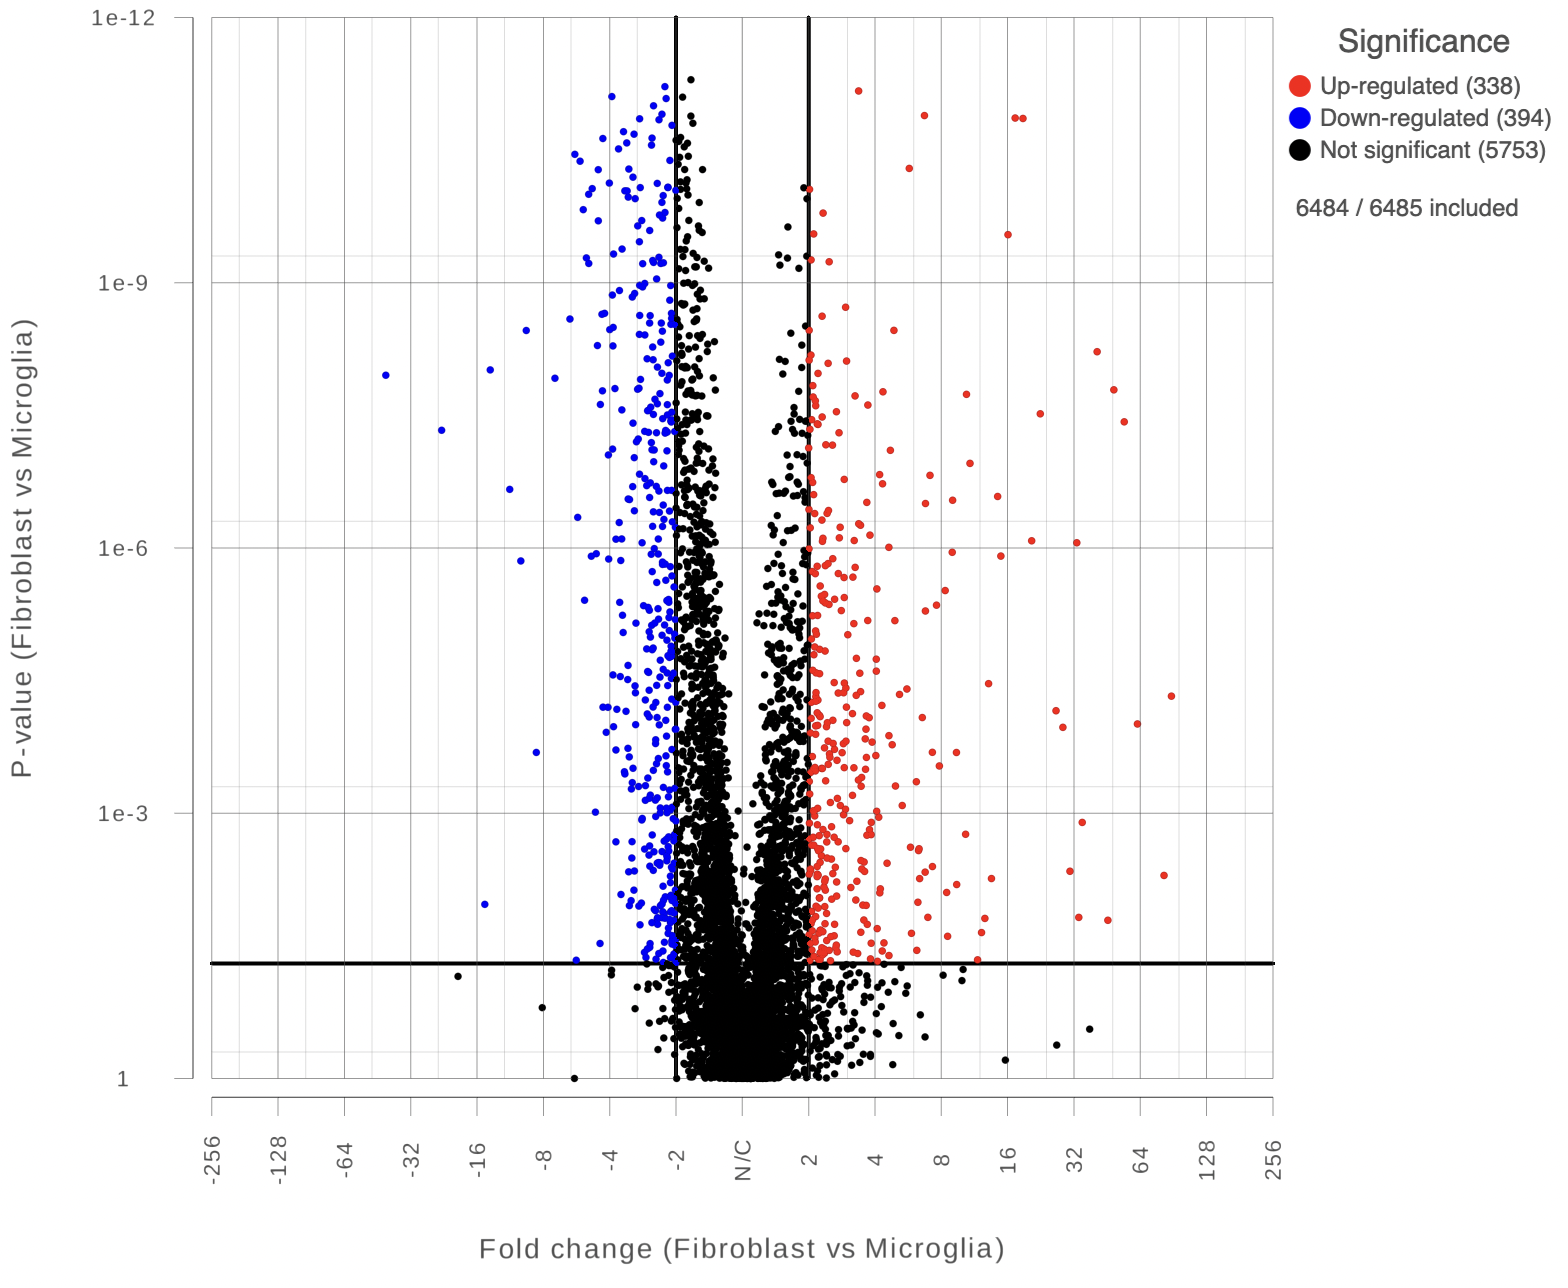
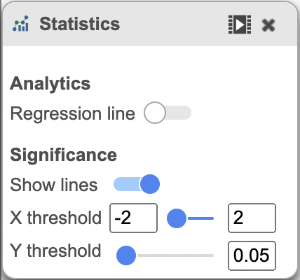
You can manually configure the Y axis source from the drop-down list and change the threshold of p-value and fold change, then the position of the lines and number of features in the significant areas will be updated accordingly. Click on the Customize colors can manually change the color of the dots (features) in the different areas
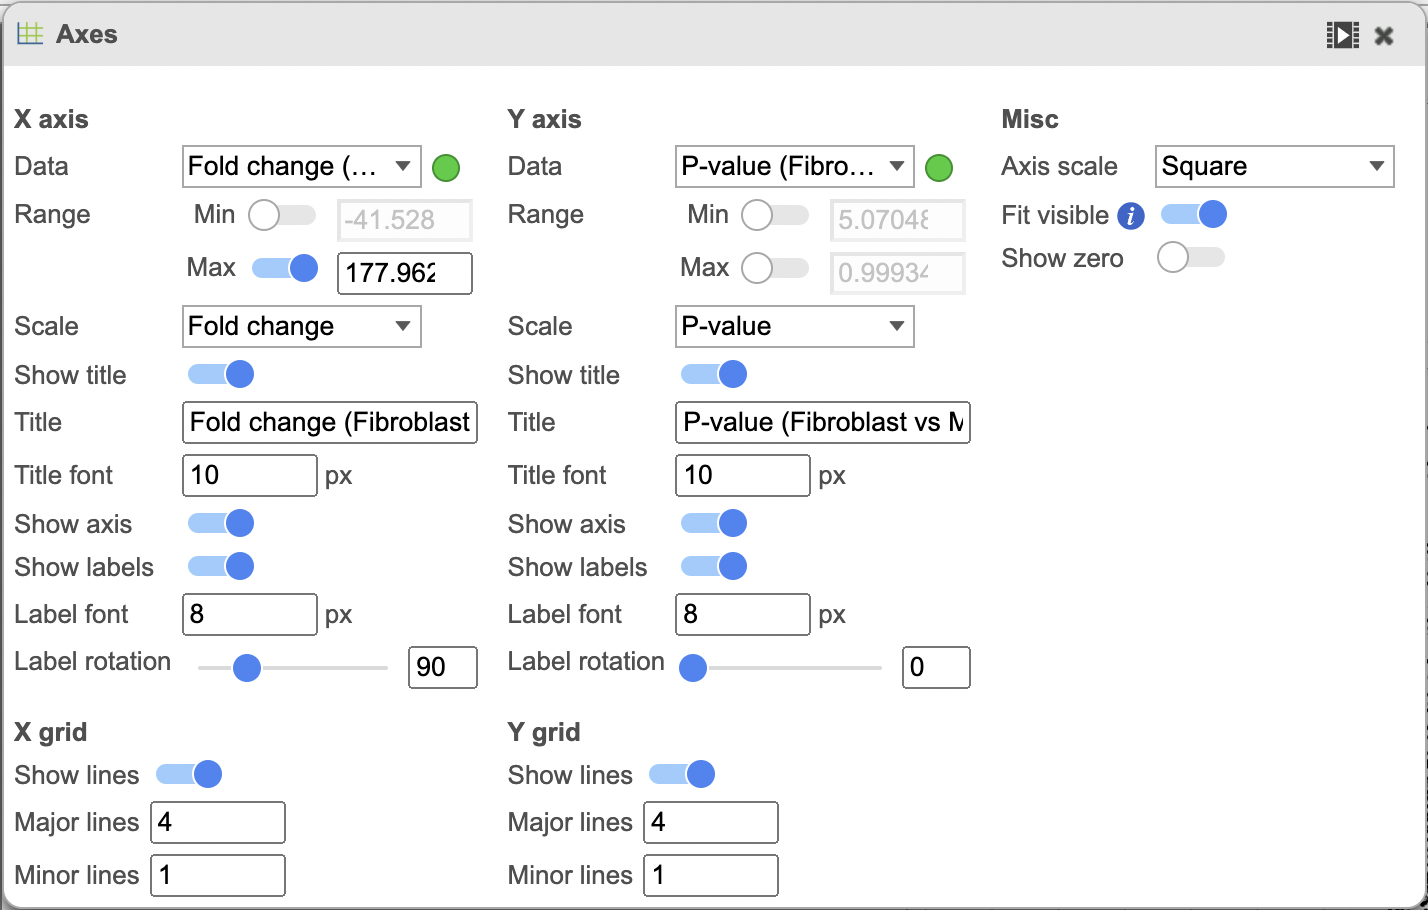
The Axes and Statistics menus allow to customize which data sources will be used for the axes as well as annotations, limits and significance thresholds for the plot (Figure 3).
| Numbered figure captions | ||||
|---|---|---|---|---|
| ||||
|
...
Overview
Content Tools