Page History
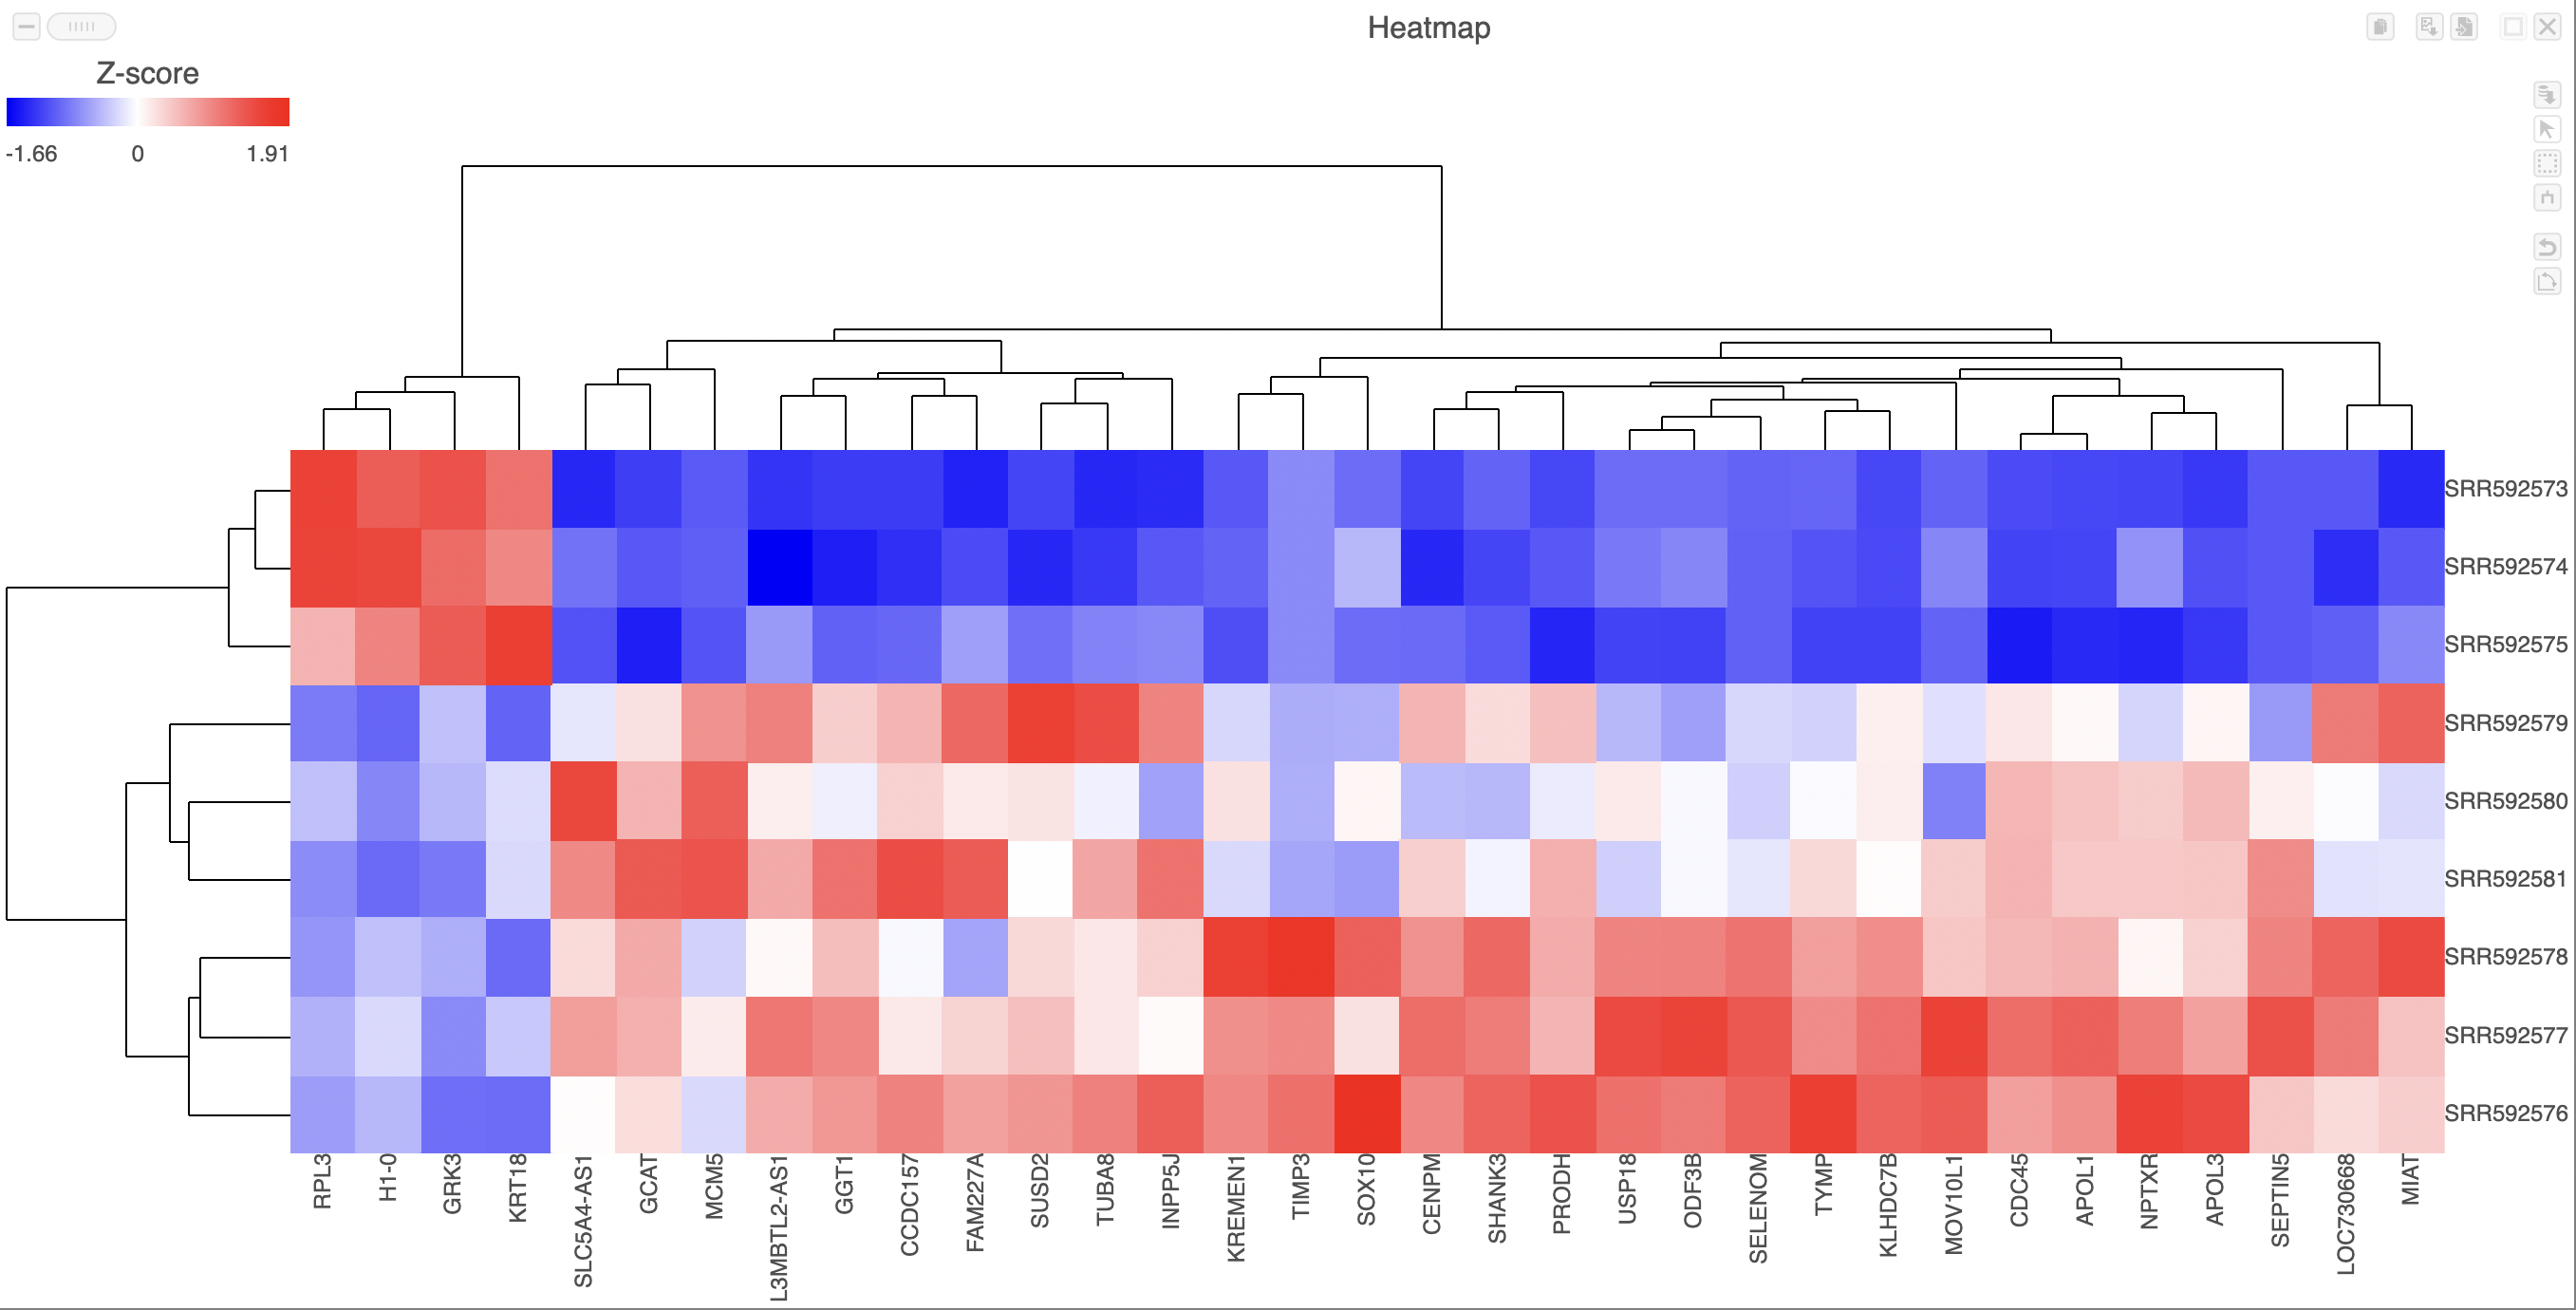
Heatmaps can be used to explore gene expression trends across samples. They are a useful tool in visualising the results of the hierarchical clustering of a gene list. It They can be employed to visually distinguish between different samples and different treatments across a dataset. After having performed a hierarchical clustering task, double-clicking the Hierarchical clustering / heatmap task node will automatically launch the heatmap in a new data viewer session (Figure 1).
...
| Numbered figure captions | ||||
|---|---|---|---|---|
| ||||
|
...
Overview
Content Tools