Page History
...
PCA data node can also be draw as tables, when choose Table icon (![]() ), it will display the component loadings matrix in the viewer (Figure 5). The Content can be modified using the Content configuration option; the table can be paged through here or from the lower right corner.
), it will display the component loadings matrix in the viewer (Figure 5). The Content can be modified using the Content configuration option; the table can be paged through here or from the lower right corner.
| Numbered figure captions | ||||
|---|---|---|---|---|
| ||||
 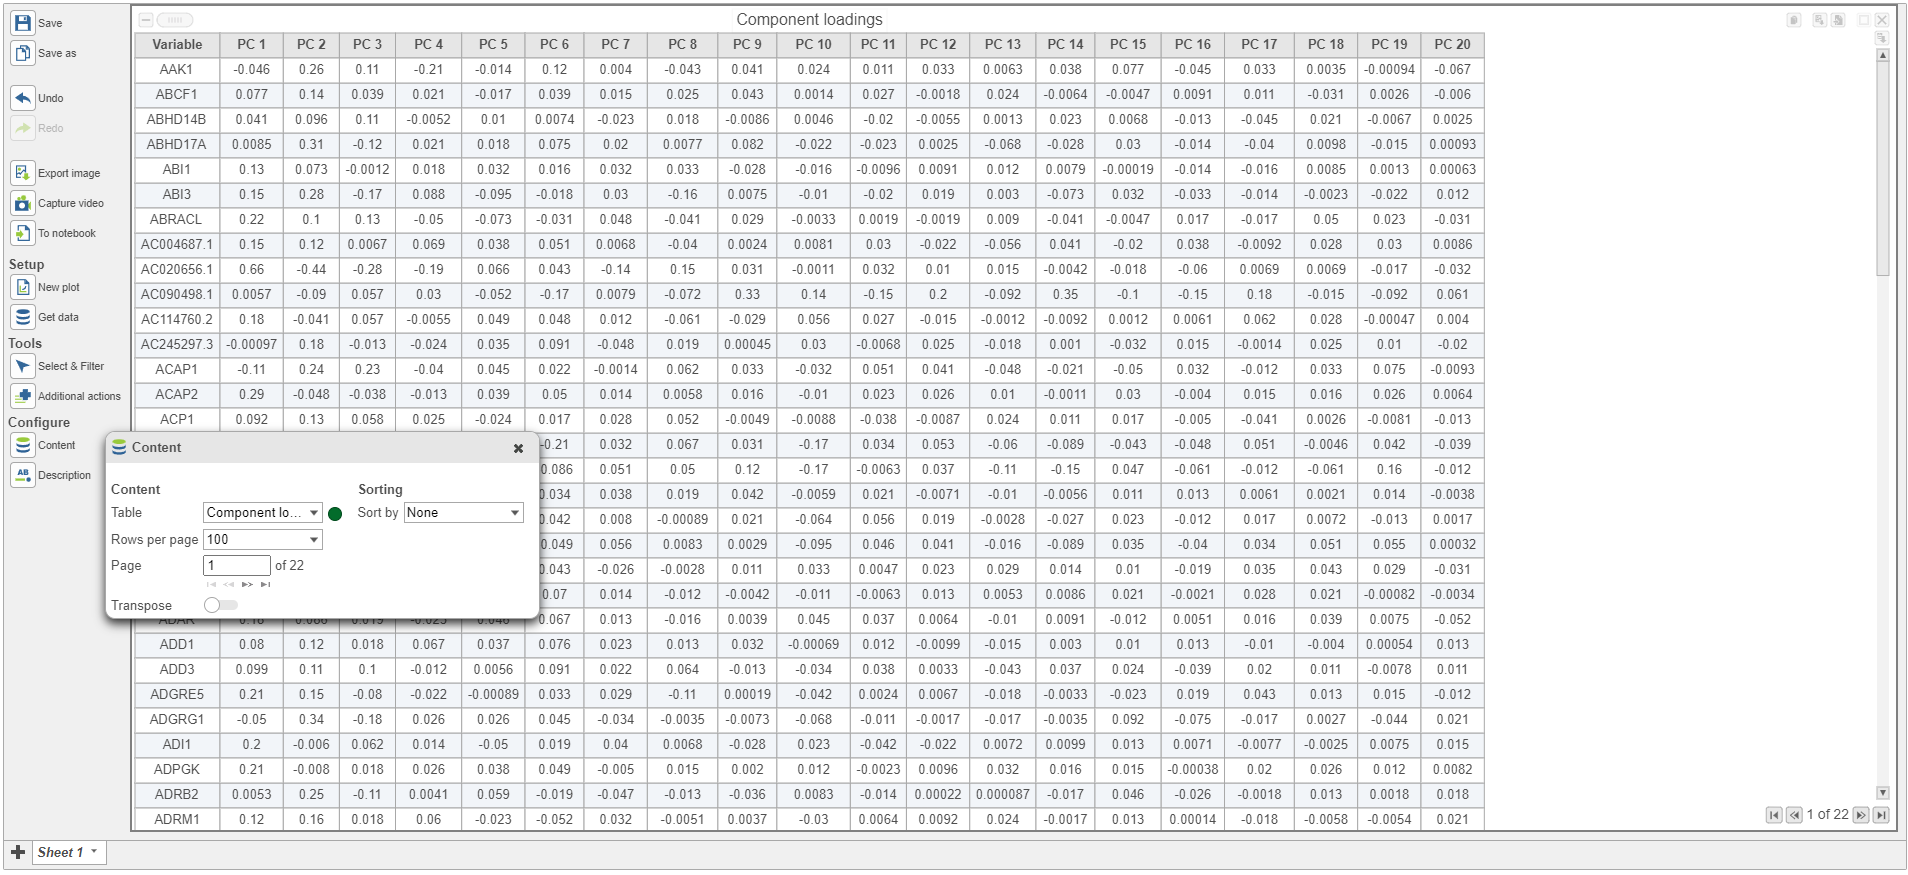 |
In the table, each row is a feature, the column represent PCs, the value is the correlation coefficient. The table can be downloaded as text file. In the configuration panel, the data table drop-down list in the content section, there is PCA projects Under Content, there is a PCA projections option, change to this option to display the projection table (Figure 6).
| Numbered figure captions | ||||
|---|---|---|---|---|
| ||||
|

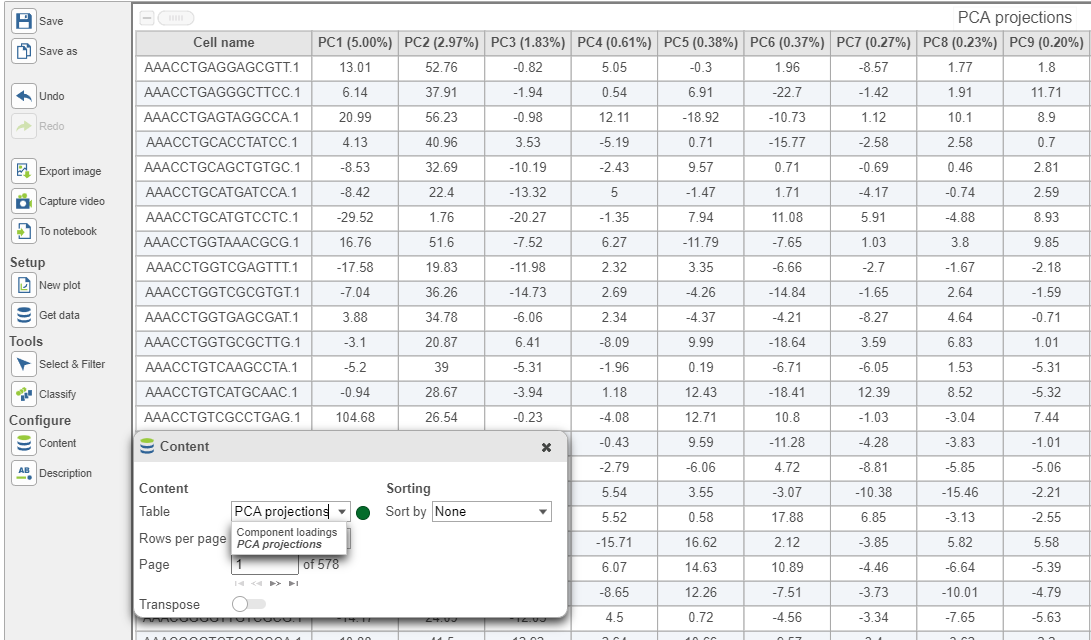
In this table, each row is an observation, each column is a PC, the values are the PC scores. The table can be downloaded as text file.
| Additional assistance |
|---|
| Rate Macro | ||
|---|---|---|
|
...
Overview
Content Tools