Page History
...
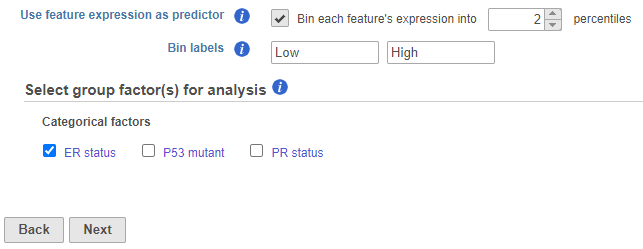
For each feature (e.g. gene), the expression values are sorted in ascending order and placed into B bins of (roughly) equal size. As a result, a feature-specific categorical attribute with B levels is constructed which can be used by itself or in combination with other categorical attributes. For instance, for B = 2 (Figure 1), we take a given feature and compute its median expression. The samples are separated into two bins, depending on whether the expression in the sample is below or above the median. The created if two percentiles are chosen, the bins are automatically labeled P_1, P_2 where P stands for “percentile”. The higher the bin number the higher the feature expression in the samples in the bin"Low" and "High" but the text box can be used to re-label the bins. The bins are feature-specific since this procedure is repeated for each feature separately.
| Numbered figure captions | ||||
|---|---|---|---|---|
| ||||
|

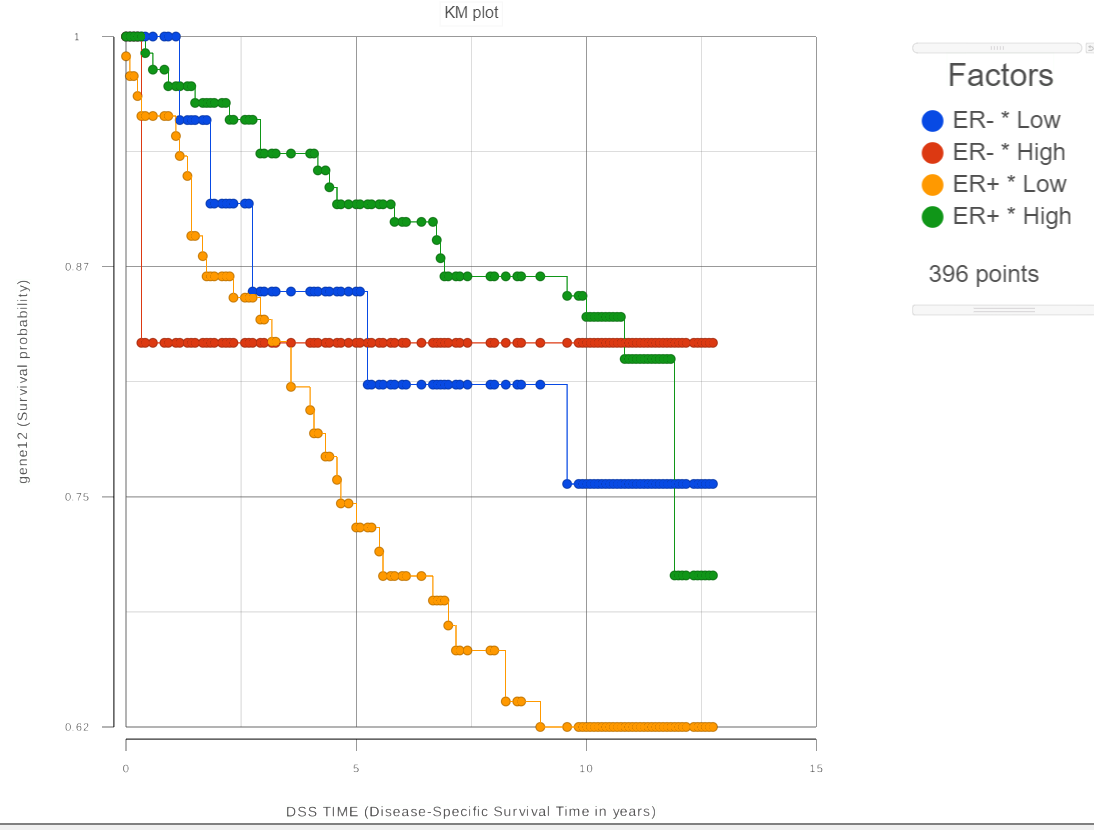
For each group, the survival curve (aka survival function) is estimated using Kaplan-Meier estimator [1]. For instance, if one selects FactorA with three ER status which has two levels and we choose two feature expression bins, six four survival curves are displayed in the Data Viewer (Figure 2). The Grouping configuration option can be used to split and modify the connections.
| Numbered figure captions | ||||
|---|---|---|---|---|
| ||||
|

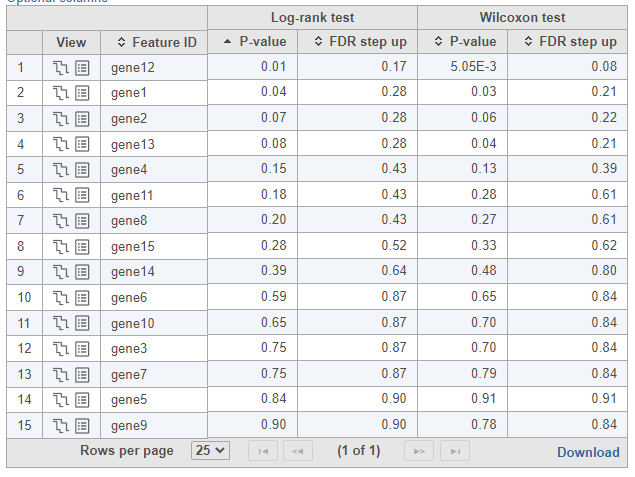
To see whether the survival curves are statistically different, Kaplan-Meier task runs Log-rank and Wilcoxon (aka Wilcoxon-Gehan) tests. The null hypothesis is that the survival curves do not differ among the groups (the computational details are available in [2]). When feature expression is used, the p-values are also feature specific (Figure 3).
| Numbered figure captions | ||||
|---|---|---|---|---|
| ||||
|

Choosing stratification factors
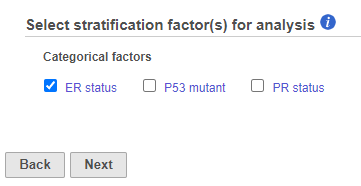
Like in Cox Regression task, it is possible to choose stratification factor(s), but the purpose and meaning of stratification are not the same as in Cox Regression. Suppose we want to compare the survival among the six four groups defined by the three two levels FactorA ER status and the two bins of feature expression. We can select the two factors on “Select group factor(s)” page (Figure 1). In that case, the reported p-values will reflect the statistical difference among the six four survival curves that are due to both FactorA ER status and the feature expression. Imagine that our primary interest is the effect of feature expression on survival. Although FactorA ER status can be important and therefore should be included in the model, we want to know whether the effect of feature expression is significant after the contribution of FactorA ER status is taken into account. In other words, the goal is to treat FactorA ER status as a nuisance factor and the binned feature expression as a factor of interest.
In qualitative terms, it is possible to obtain an answer if we group the survival curves by the level of FactorAER status. This can be achieved in the Data Viewer by choosing Grouping > Split by under Configure (Figure 4). That makes it easy to compare the survival curves that have the same level of FactorA ER status and avoid the comparison of curves across different levels of FactorAER status.
| Numbered figure captions | ||||
|---|---|---|---|---|
| ||||
|

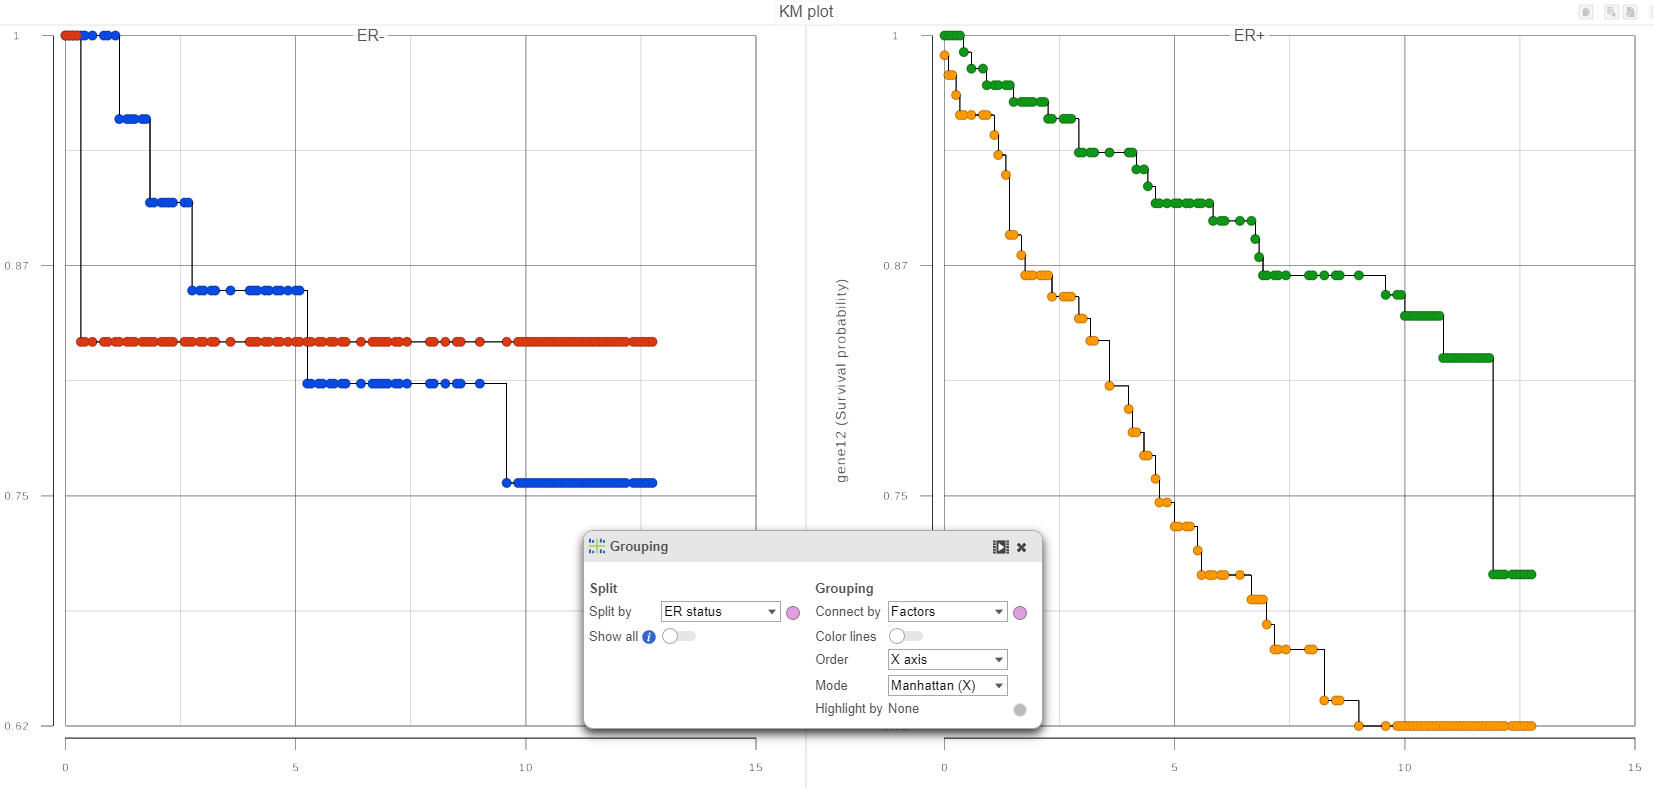
If in Figure 4, we see one or more subplot where the survival curves differ a lot, that is evidence that the feature expression affects the survival even after adjusting for the contribution of FactorAER status. To obtain an answer in terms of adjusted Log-rank and Wilcoxon p-values, one should deselect FactorA ER status as a “group factor” (Figure 1) and mark it as a stratification factor instead (Figure 5). The computation of stratification adjusted p-values is elaborated in [2].
| Numbered figure captions | ||||
|---|---|---|---|---|
| ||||
  |
Suppose when the feature expression and FactorA ER status are selected as “group factors” (Figure 1), Log-rank p-value is 0.001, and when FactorA ER status is marked as stratification factor, the p-value becomes 0.70. This means that FactorA ER status is very useful for explaining the difference in survival while the feature factor is of no use if FactorA ER status is already in the model. In other words, the marginal contribution of the binned expression factor is low.
...
Overview
Content Tools