Page History
...
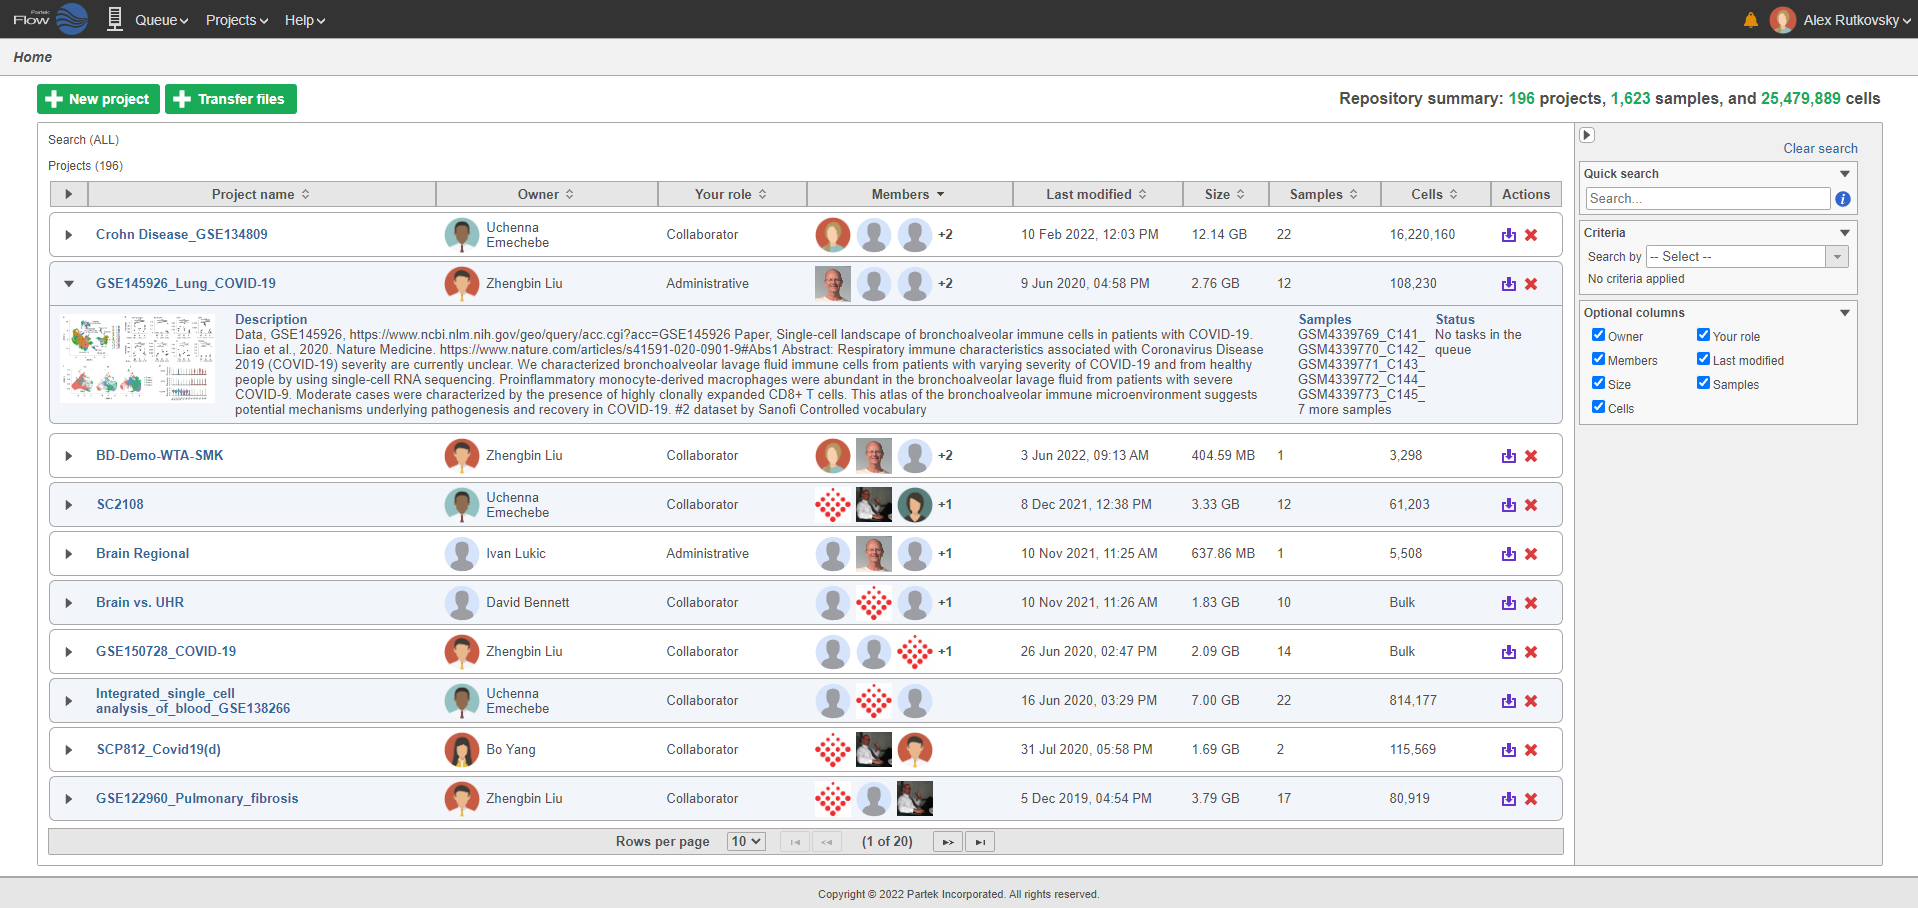
The Partek® Flow® Home page is the first page displayed upon login. It provides a quick overview of recent activities and provides access to several system options (Figure 1).
| Numbered figure captions | ||||
|---|---|---|---|---|
| ||||
|
Home Page Icons
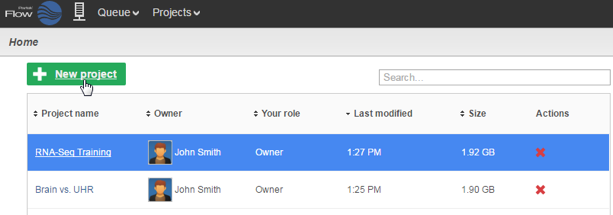
Shown at the top of the Home page, the New project button  provides a quick link to create a new project in your Partek Flow server.
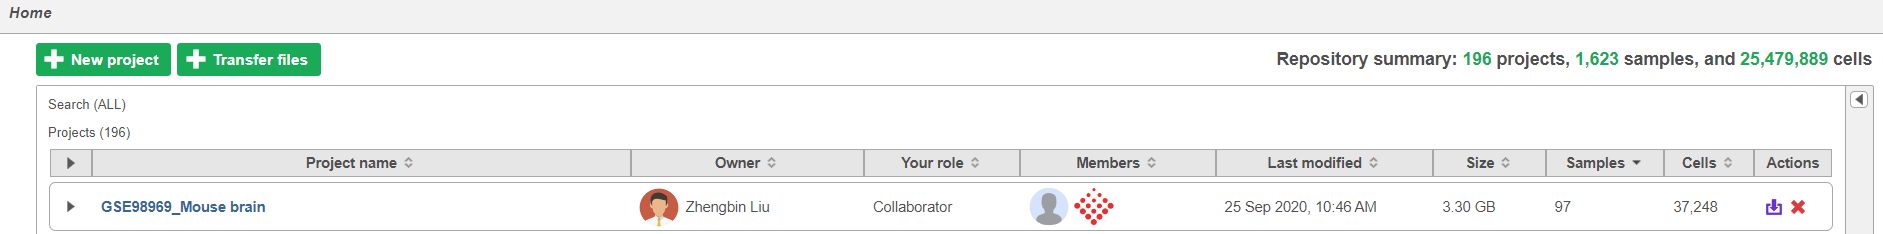
The Transfer files button  is used to transfer data to the server.
Under the Actions column, the iconthe ![]() allows icon allows you to quickly delete projects and the
allows icon allows you to quickly delete projects and the ![]() icon allows you to export projects (Figure 2).
icon allows you to export projects (Figure 2).
| Numbered figure captions | ||||
|---|---|---|---|---|
| ||||
|
System Options
The drop-down menu in the upper right corner of the Home page (Figure 3) displays options that are not related to a project or a task, but to the Partek Flow application as a whole. This links to the following pages: Settings, Help, Contact Us, Profile and gives you the option to log out of your server.
| Numbered figure captions | ||||
|---|---|---|---|---|
| ||||
|
...
The left-most icon is the progress indicator, summarizing the current status of the Partek Flow server. If no tasks are being processed, the icon is grey and static and the idle message is shown upon mouse over (Figure 4).
| Numbered figure captions | ||||
|---|---|---|---|---|
| ||||
|

If the server is running, the progress indicator will depict green bars animated on the server icon (Figure 5).
| Numbered figure captions | ||||
|---|---|---|---|---|
| ||||
|
Selecting the Queue dropdown will list the number of running tasks launched by the user. Additional information about the queue including the estimated completion time as well the total number of queued tasks launched can be obtained by selecting View queued tasks (Figure 6).
| Numbered figure captions | ||||
|---|---|---|---|---|
| ||||
|
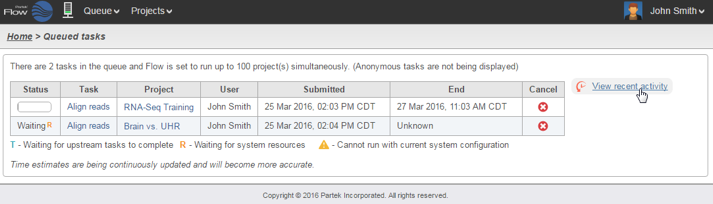
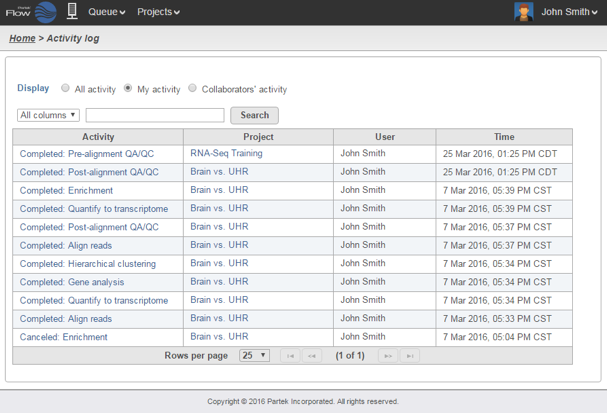
To view all previous tasks, select the View recent activity link. Clicking this link loads the Activity log page (Figure 7). It displays all the tasks within the projects accessible to the user (either as the owner or as a collaborator), including the tasks launched by other users of the Partek Flow instance.
| Numbered figure captions | ||||
|---|---|---|---|---|
| ||||
|
...
The Activity log page also contains a search function that can help find a particular task (Figure 8). Search can be performed through the entire log (All columns), or narrowed down to one of the columns (using the drop-down list).
| Numbered figure captions | ||||
|---|---|---|---|---|
| ||||
|
...
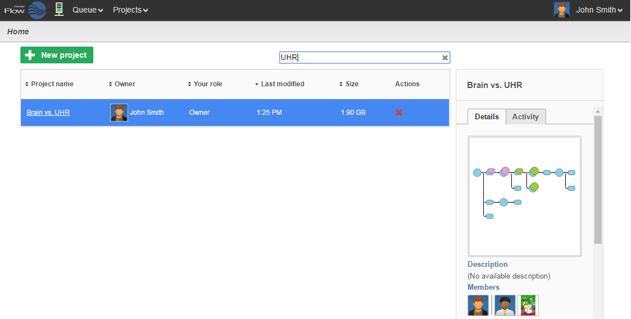
In the Home page, the table listing all the projects can be sorted by clicking the sort icon to the left of the table headers. By default, the table is sorted by the date when the project was last modified. You can enter project names, owners as well as sample names in the search box to find a specific project (Figure 9).
| Numbered figure captions | ||||
|---|---|---|---|---|
| ||||
|
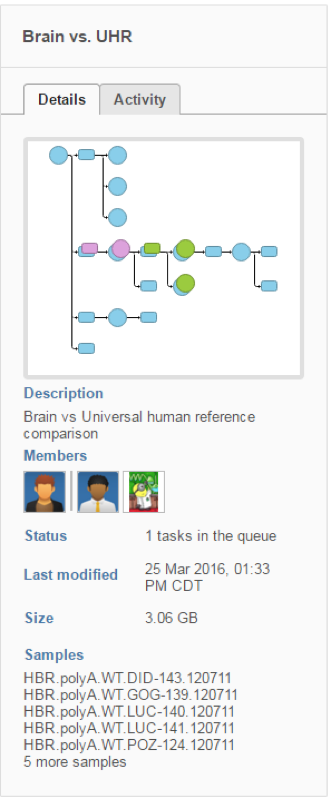
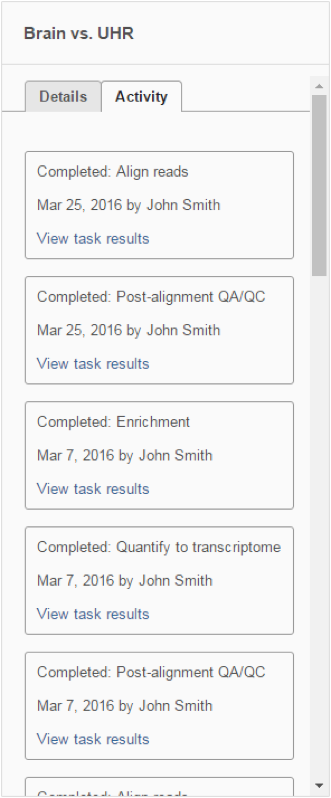
Selecting a project will display the Details tab on the right (Figure 10). This shows a preview of the Task graph for the select project, a short description, the members that have access to the project, date last modified, queue status, size and samples contained within the project. On the other hand, the Activity tab lists recent tasks that have been performed in the project.
| Numbered figure captions | ||||
|---|---|---|---|---|
| ||||
|
| Additional assistance |
|---|
| Rate Macro | ||
|---|---|---|
|
...
Overview
Content Tools