Page History
...
- Choose a gene/feature annotation from the drop-down menu
- Click Finish to run
In this data set, a reasonable cut-off could be set anywhere between 7 and 20 PCs.
Viewing the genes correlated with each PC can be useful when choosing how many PCs to include.
...
TF-IDF (frequency-inverse document frequency) normalization
Latent semantic indexing (LSI) was first introduced for the analysis of scATAC-seq data by Cusanovich et al. 2018[2]. LSI combines steps of frequency-inverse document frequency (TF-IDF) normalization followed by singular value decomposition (SVD). Partek® Flow® wrapped Signac's TF-IDF normalization for single cell ATAC-seq dataset. It is a two-step normalization procedure that both normalizes across cells to correct for differences in cellular sequencing depth, and across peaks to give higher values to more rare peaks[3].
TF-IDF normalization in Flow can be invoked in Normalization and scaling section by clicking any single cell counts data node (Figure 10).
| Numbered figure captions | ||||
|---|---|---|---|---|
| ||||
|

This table lists genes on rows and PCs on columns, the value in this table is correlation coefficient r. The table can be downloaded as a text file by clicking on the Export table data icon ![]() on the upper-right corner of the plot.
on the upper-right corner of the plot.
...
| Numbered figure captions | ||||
|---|---|---|---|---|
| ||||
|

PCA projections table contains each row as an observation (a cell in this case), each column represents one principal component (Figure 10). This table can be downloaded as text file, the same way as the component loading table.
|
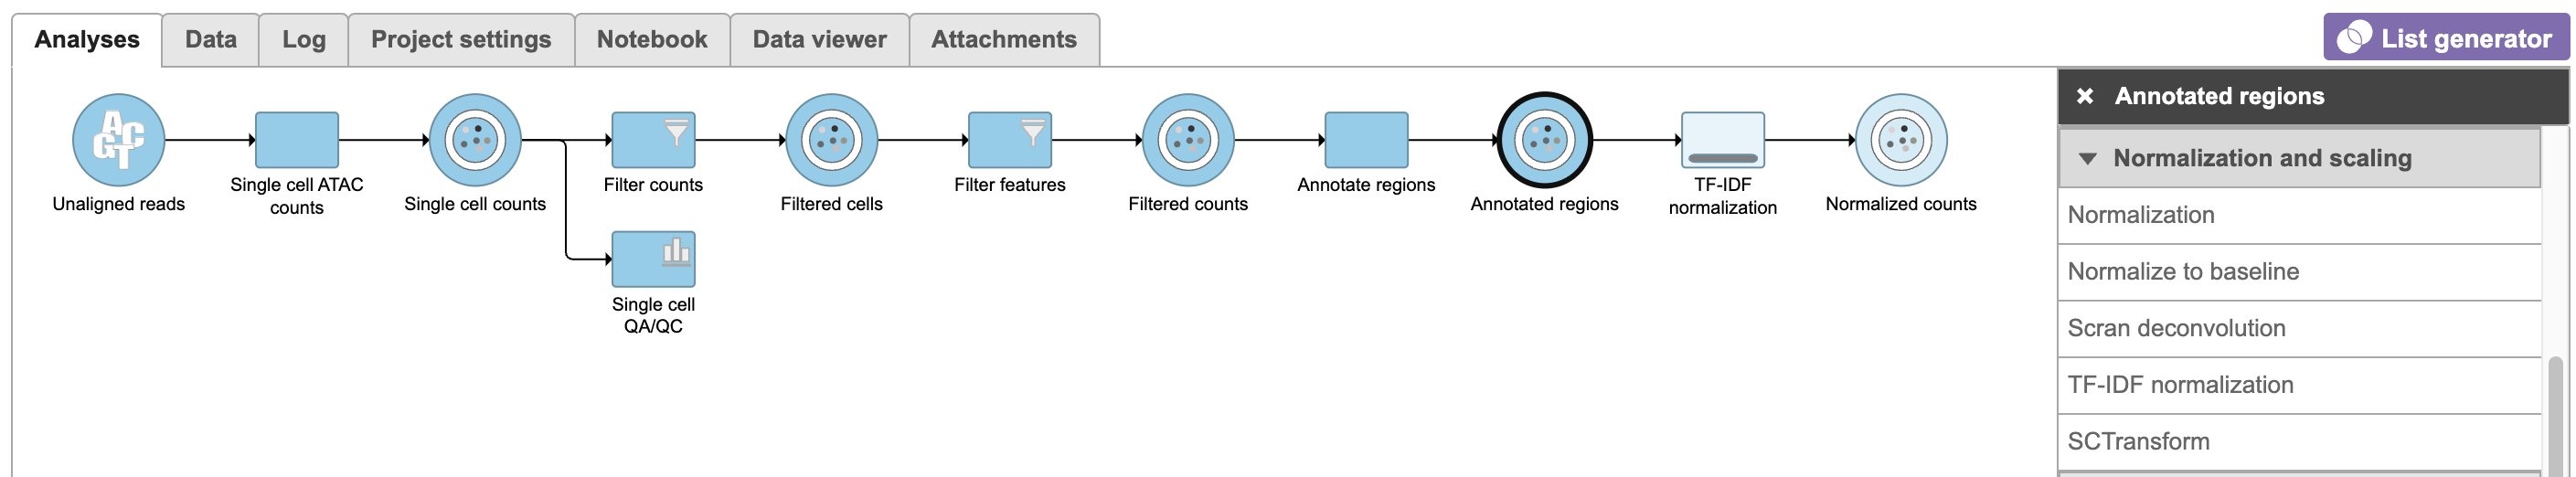
To run TF-IDF normalization,
- Click a single cell counts data node
- Click the Normalization and scaling section in the toolbox
- Click TF-IDF normalization
The output of TF-IDF normalization is a new data node that has been normalized by log(TF x IDF).
SVD (singular value decomposition )
Singular value decomposition (SVD) will be applied to TF-IDF output in scATAC-Seq data. It returns a reduced dimension representation of a matrix. Although SVD and Principal components analysis (PCA) are two different techniques, the SVD has a close connection to PCA. Because PCA is simply an application of the SVD. For users who are more familiar with scRNA-Seq, you can think of SVD as analogous to the output of PCA. And similarly, the statistical interpretation of singular values is in the form of variance in the data explained by the various components.
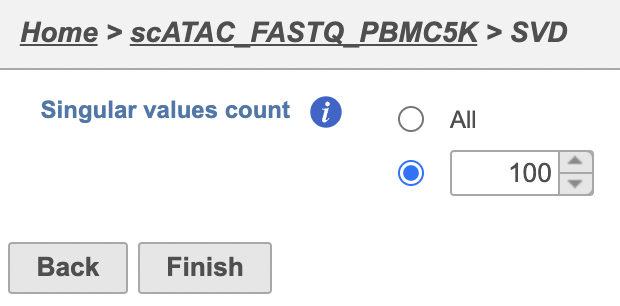
To run SVD task,
- Click a Normalized counts data node
- Click the Exploratory analysis section in the toolbox
- Click SVD
The GUI is simple and easy to understand. The SVD dialog is only asking to select the number of singular values to compute (Figure 11). By default 100 singular values will be computed if users don't want to compute all of them. However, the number could be adjusted manually or typed in directly. Simply click the Finish button if you want to run the task as default.
The task report for SVD is similar to PCA. Its output will be used for downstream analysis and visualization, including Harmony and WNN.
| Numbered figure captions | ||||
|---|---|---|---|---|
| ||||
|

Graph-based clustering
...
Overview
Content Tools