Page History
...
Blacklist ratio: The ENCODE project has provided a list of blacklist regions, representing reads which are often associated with artifactual signals. Cells with a high proportion of reads mapping to these areas (compared to reads mapping to peaks) often represent technical artifacts and should be removed.
PCA
Principal components (PC) analysis (PCA) is an exploratory technique that is used to describe the structure of high dimensional data by reducing its dimensionality. Because PCA is used to reduce the dimensionality of the data prior to clustering as part of a standard single cell analysis workflow, it is useful to examine the results of PCA for your data set prior to clustering.
...
Filter cells
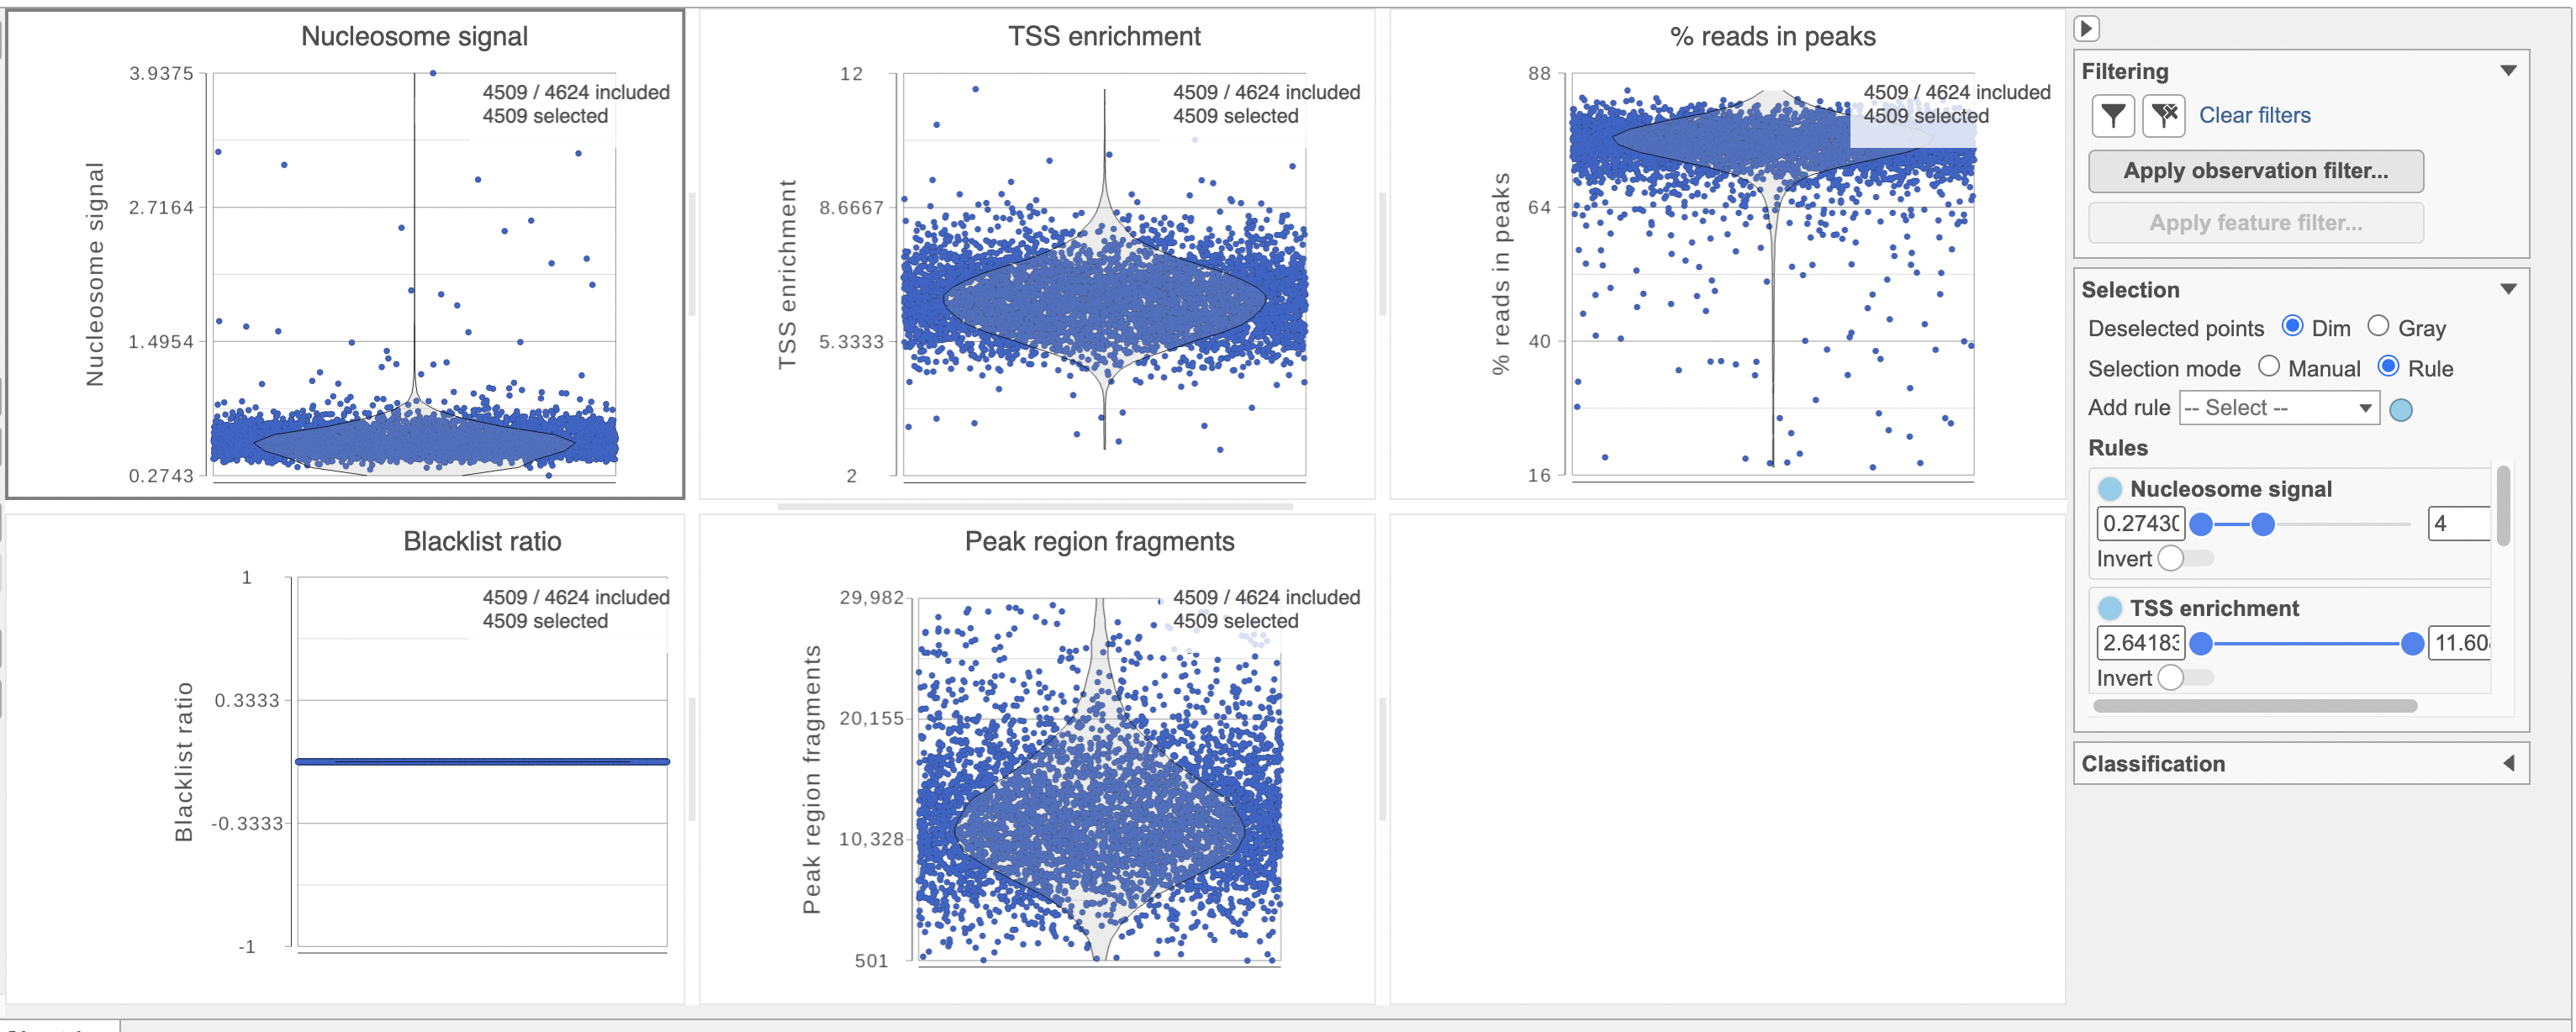
To filter out low quality cells (Figure 7),
- Set the filters on nucleosome signal < 4; Peak region fragment 500-30000; and % reads in peaks > 15% ; Blacklist ratio < 0.05
- Click the filter icon and Apply observation filter to run the Filter cells task on the first Single cell counts data node, it generates a Filtered cells node
- Click PCA from the drop-down list
You can choose Features contribute equally to standardize the genes prior to PCA or allow more variable genes to have a larger effect on the PCA by choosing by variance. By default, we take variance into account and focus on the most variable genes.
...
| Numbered figure captions | ||||
|---|---|---|---|---|
| ||||
|

- Click Finish to run
A new PCA task node will be produced.
...
|
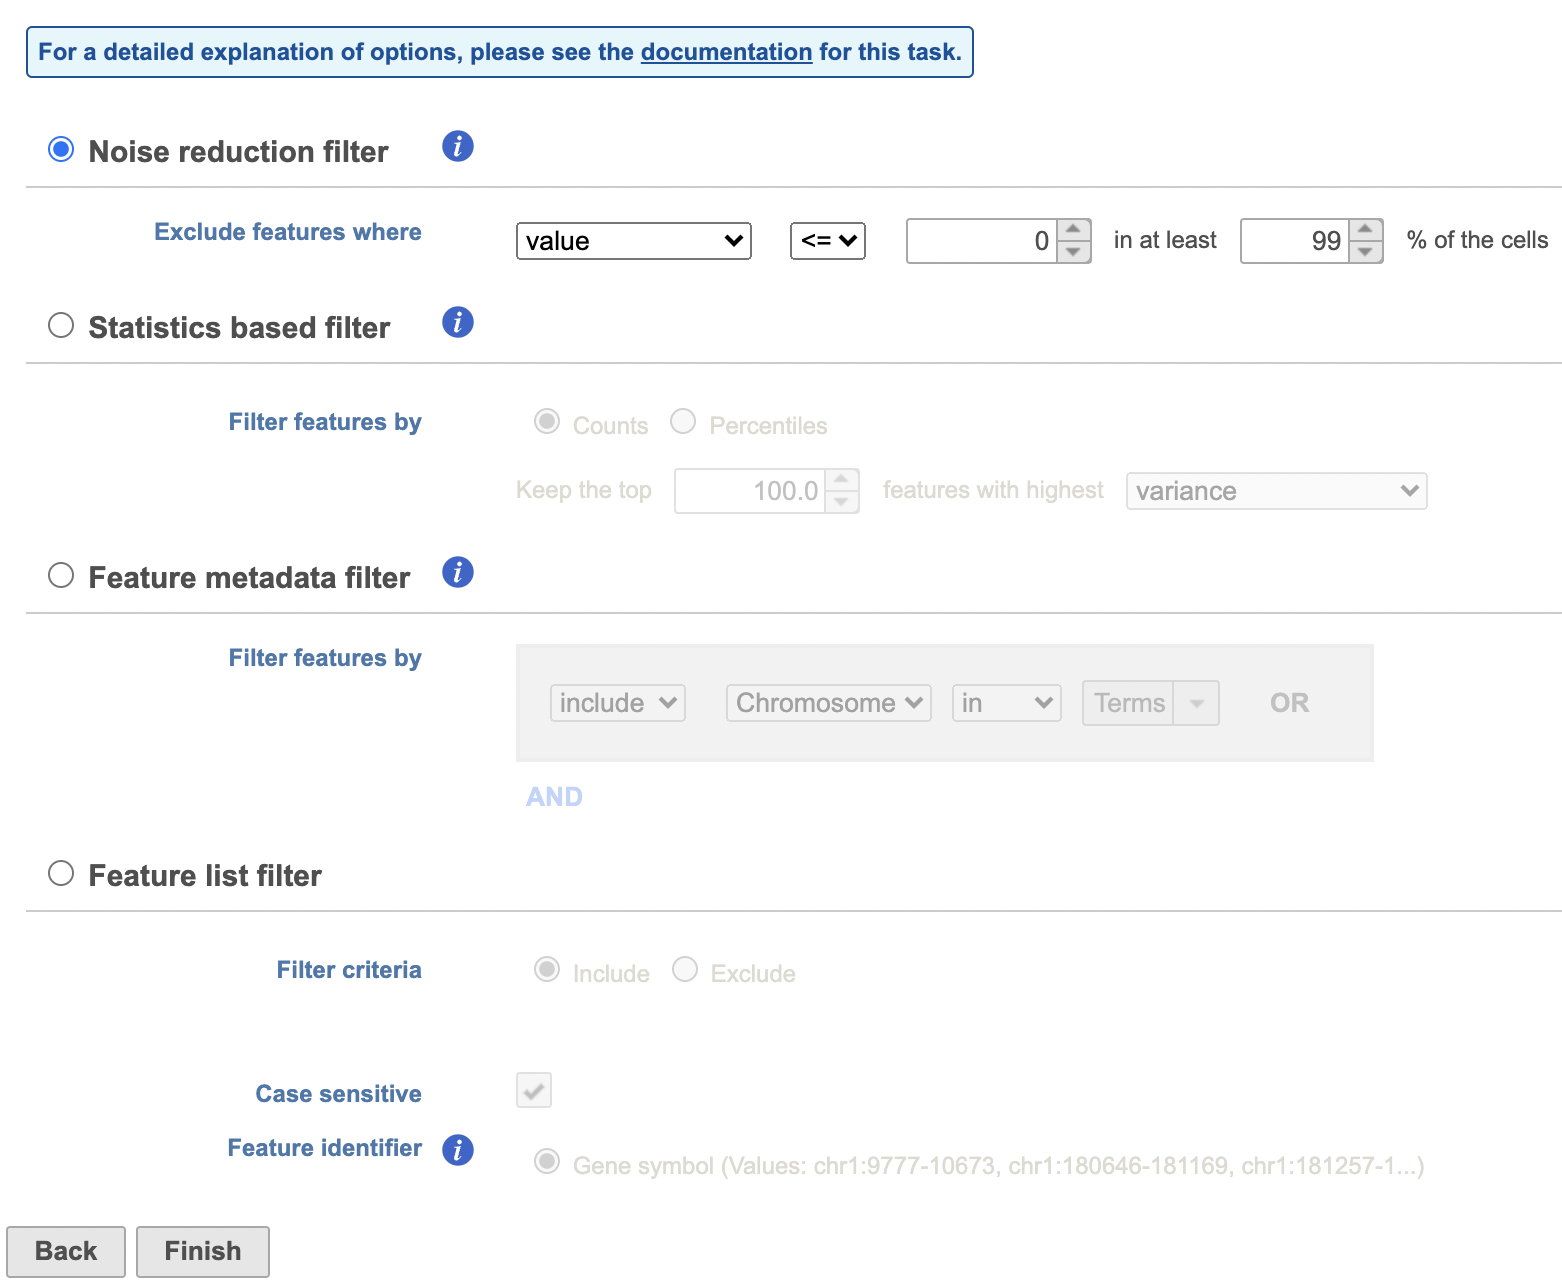
Filter features
Another common task is to filter the data to include only informative features. Partek Flow has a wide variety of flexible filtering options.
Filter features task can be invoked from any counts or single cell data node. Noise Reduction and Statistics Based filters take each feature and perform the specified calculation across all the cells. The filter is applied to the values in the selected data node and the output is a filtered version of the input data node.
In the task dialog, click the check box to activate one or more of the filter types, configure the filter(s), and click Finish to run (Figure 8).
| Numbered figure captions | ||||
|---|---|---|---|---|
| ||||
|

Beside PCA coordinates of the cells, PCA task report also includes, the Scree plot, the component loadings table, and the PC projections table.
The Scree plot lists PCs on the x-axis and the amount of variance explained by each PC on the y-axis, measured in Eigenvalue. The higher the Eigenvalue, the more variance is explained by the PC. Typically, after an initial set of highly informative PCs, the amount of variance explained by analyzing additional PCs is minimal. By identifying the point where the Scree plot levels off, you can choose an optimal number of PCs to use in downstream analysis steps like graph-based clustering, UMAP and t-SNE.
...
|
Annotate regions
To understand the importance of enriched regions in regulating gene expression, Flow uses Annotate regions task to add information about overlapping or nearby genomic features. That gives regulatory context for enriched regions.
The input for Annotate peaks is a Peaks type data node.
- Click a Peaks data node
- Click the Peak analysis section in the toolbox
- Click Annotate regions
- Set the Genomic overlaps parameter
The Genomics overlaps parameter lets you choose one of two options (Figure 9).
- Report one gene region per peak (precedence applies) chooses one gene section for each peak using the precedence order to settle cases where more than one gene section overlaps a peak. The order of precedence is TSS, TTS, CDS Exon, 5' UTR Exon, 3' UTR Exon, Intron, Intergenic.
- Report all gene regions per peak creates a row for each gene section that overlaps a peak in the task report.
| Numbered figure captions | ||||
|---|---|---|---|---|
| ||||
|

- Mouse over the Scree plot to identify the point where additional PCs offer little additional information
|
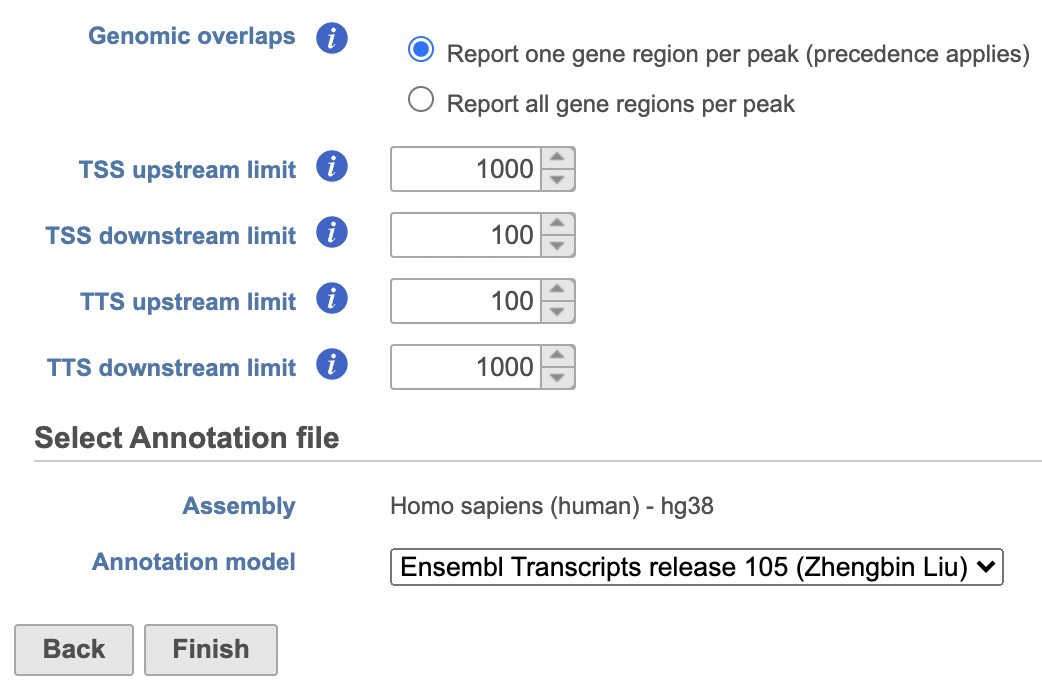
Users are able to define the transcription start site (TSS) and transcription termination site (TTS) limit in the unit of bp.
- Choose a gene/feature annotation from the drop-down menu
- Click Finish to run
In this data set, a reasonable cut-off could be set anywhere between 7 and 20 PCs.
Viewing the genes correlated with each PC can be useful when choosing how many PCs to include.
...
Overview
Content Tools