Page History
...
This guide illustrates how to process FASTQ files produced using the 10x Genomics Chromium Single Cell ATAC assay to obtain a Single cell counts data node, which is the starting point for analysis of single-cell ATAC experiments.
If you are new to Partek Flow, please see Getting Started with Your Partek Flow Hosted Trial for information about data transfer and import and Creating and Analyzing a Project for information about the Partek Flow user interface.
...
| Numbered figure captions | ||||
|---|---|---|---|---|
| ||||
|
- Click the Single cell QA/QC node once it finishes running
- Double-click the Task report in the task menu
The Single cell QA/QC report includes interactive violin plots showing the value of every cell in the project on several quality measures (Figure 2).
| Numbered figure captions | ||||
|---|---|---|---|---|
| ||||
|

There can be four plots: number of read counts per cell, number of detected genes per cell, the percentage of mitochondrial reads per cell, and the percentage of ribosomal counts.
Each point on the plots is a cell and the violins illustrate the distribution of values for the y-axis metric. Cells can be filtered either with the plot controls by using the selection tools on the right of the plot (rectangle mode ![]() , ellipse mode
, ellipse mode ![]() , or lasso mode
, or lasso mode ![]() ) and selecting a region on one of the plots or by setting thresholds using the Select & Filter
) and selecting a region on one of the plots or by setting thresholds using the Select & Filter ![]() tool. Here, we will apply a filter for the number of read counts.
tool. Here, we will apply a filter for the number of read counts.
The plots will be shaded to reflect the selection. Cells that are excluded will be shown as dim dots on all plots.
The read counts per cell and number of detected genes per cell are typically used to filter out potential doublets - if a cell as an unusually high number of total counts or detected genes, it may be a doublet. The mitochondrial reads percentage can be used to identify cells damaged during cell isolation - if a cell has a high percentage of mitochondrial counts, it is likely damaged or dying and may need to be excluded.
- Open the
 Select & Filter icon in the left panel. The histograms can be pinned while fine tuning the selections (Figure 2). Set the filters to represent the majority of the population (violin width)
 - Click the filter icon
 and Apply observation filter then select the Single cell counts data node to run the Filter cells task on the first Single cell counts data node, it generates a Filtered counts task node that generates a Filtered cells results node
 - Use
 Save as to give this Data Viewer session a new name (e.g. QA/QC filter) so you can return to this filter at any time and see the exact criteria that has been selected and filtered.
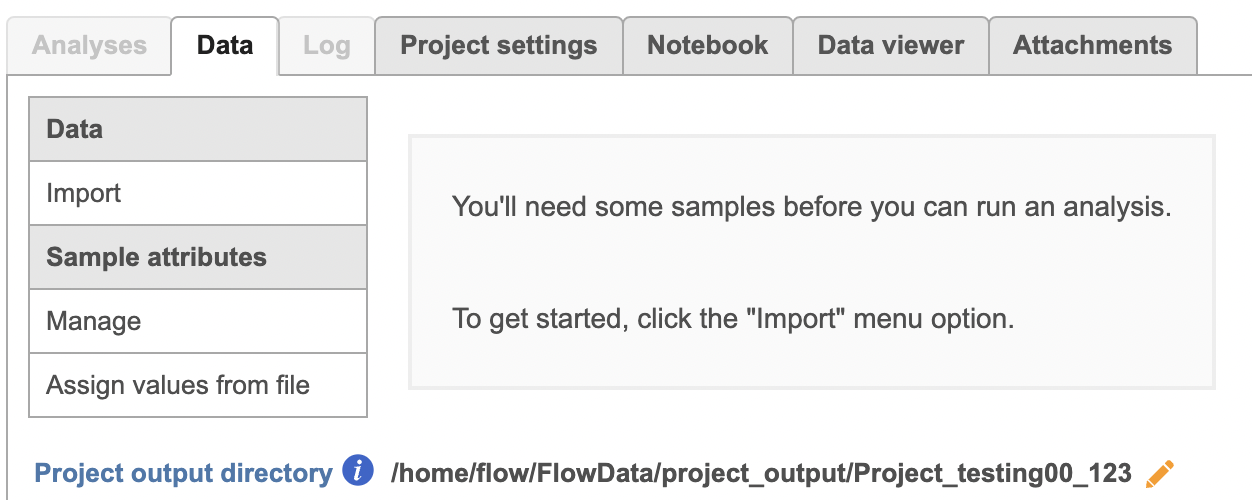
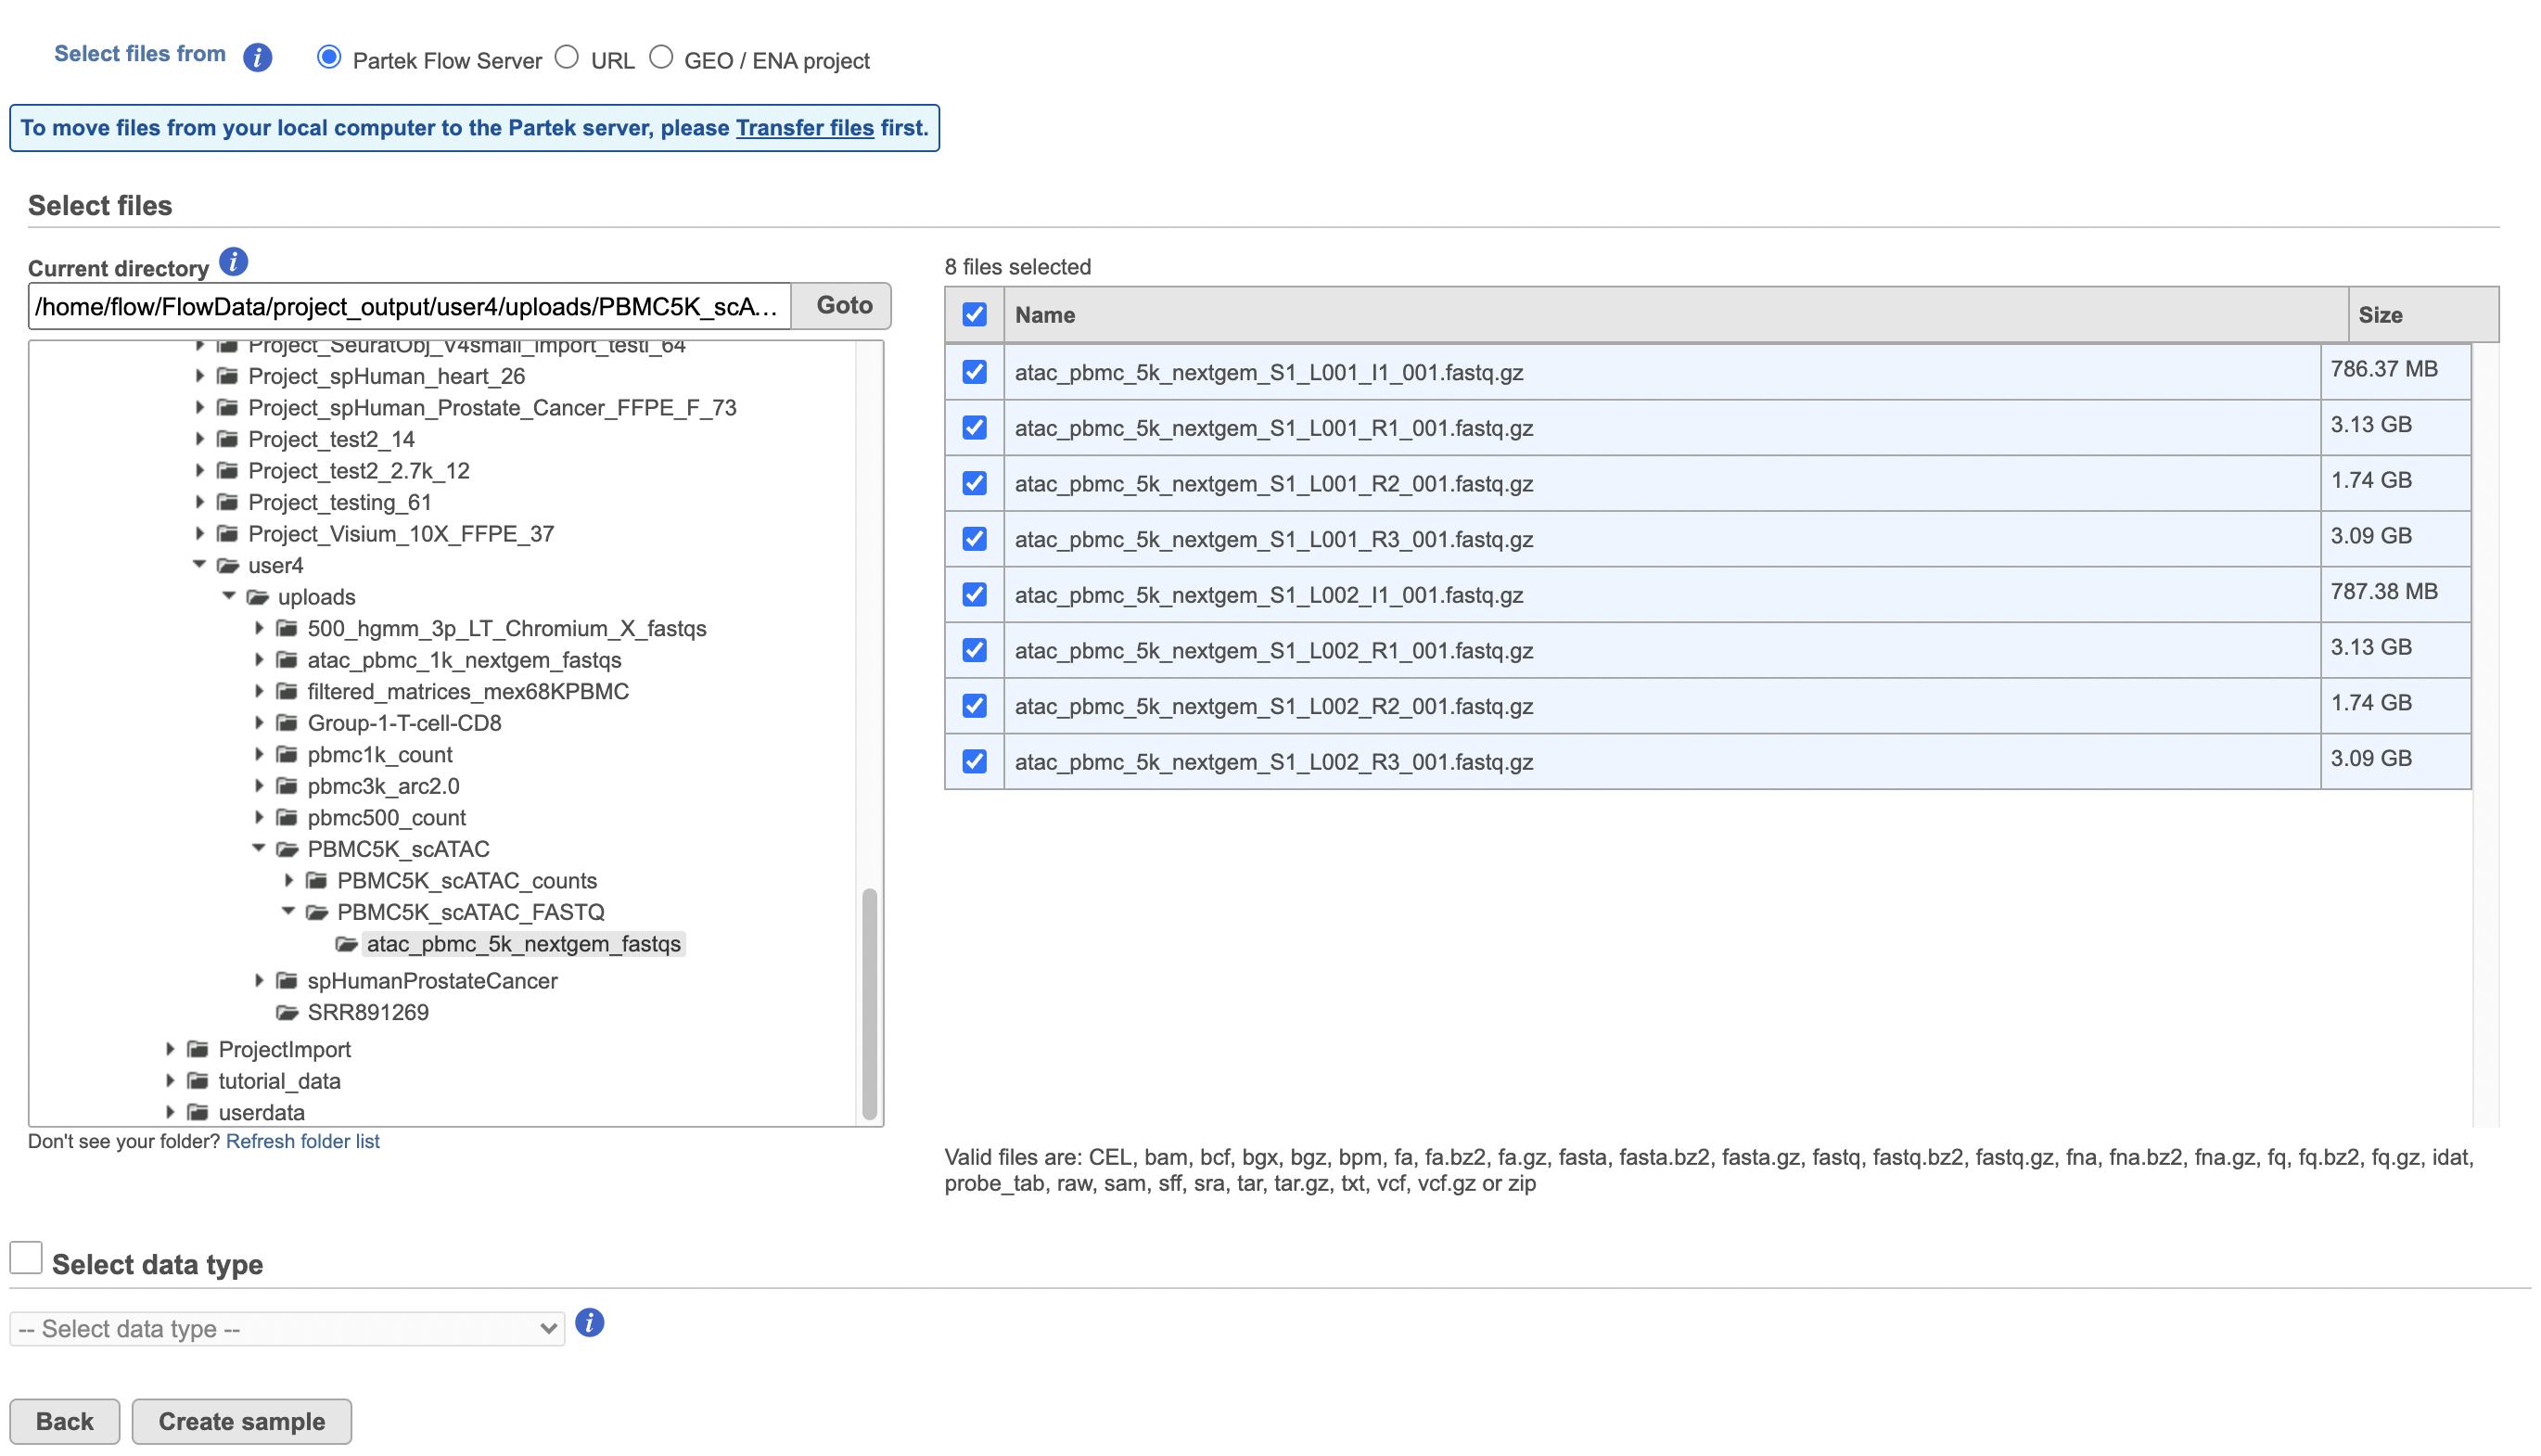
Import the FASTQ files
To proceed, click the Import button in the Data tab (Figure 2). Click the Automatically create samples from files button. The file browser interface will open (Figure 3). Select the FASTQ files using the file browser interface and push the Create sample button to complete the task. Paired end reads will be automatically detected and multiple lanes for the same sample will be automatically combined into a single sample. We encourage users to include all the FASTQ files including the index files although they are optional.
When the FASTQ files have finished importing, the Unaligned reads data node will turn from transparent to opaque.
| Numbered figure captions | ||||
|---|---|---|---|---|
| ||||
|
| Numbered figure captions | ||||
|---|---|---|---|---|
| ||||
|
Normalization
Because different cells will have a different number of total counts, it is important to normalize the data prior to downstream analysis. For droplet-based single cell isolation and library preparation methods that use a 3' counting strategy, where only the 3' end of each transcript is captured and sequenced, we recommend the following normalization - 1. CPM (counts per million), 2. Add 1, 3. Log2. This accounts for differences in total UMI counts per cell and log transforms the data, which makes the data easier to visualize.
...
Overview
Content Tools