Page History
...
| Numbered figure captions | ||||
|---|---|---|---|---|
| ||||
|
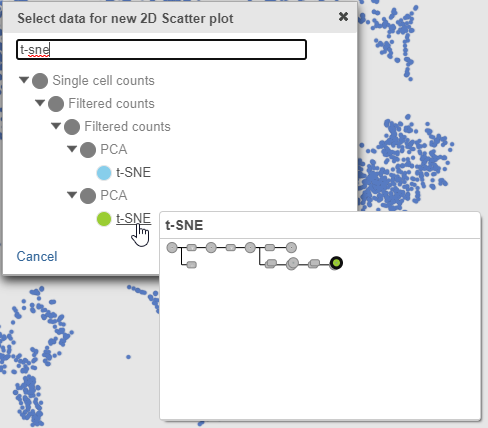
- Search for and select green t-SNE data node (Figure 25)
...
| Numbered figure captions | ||||
|---|---|---|---|---|
| ||||
|
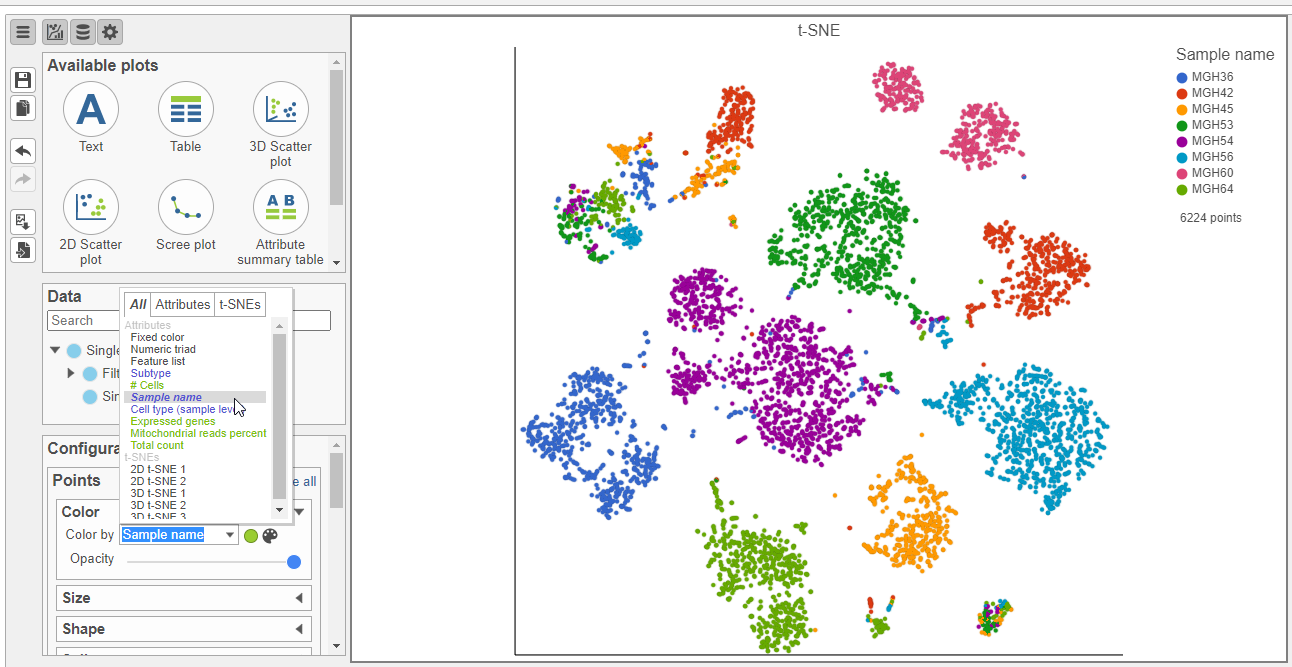
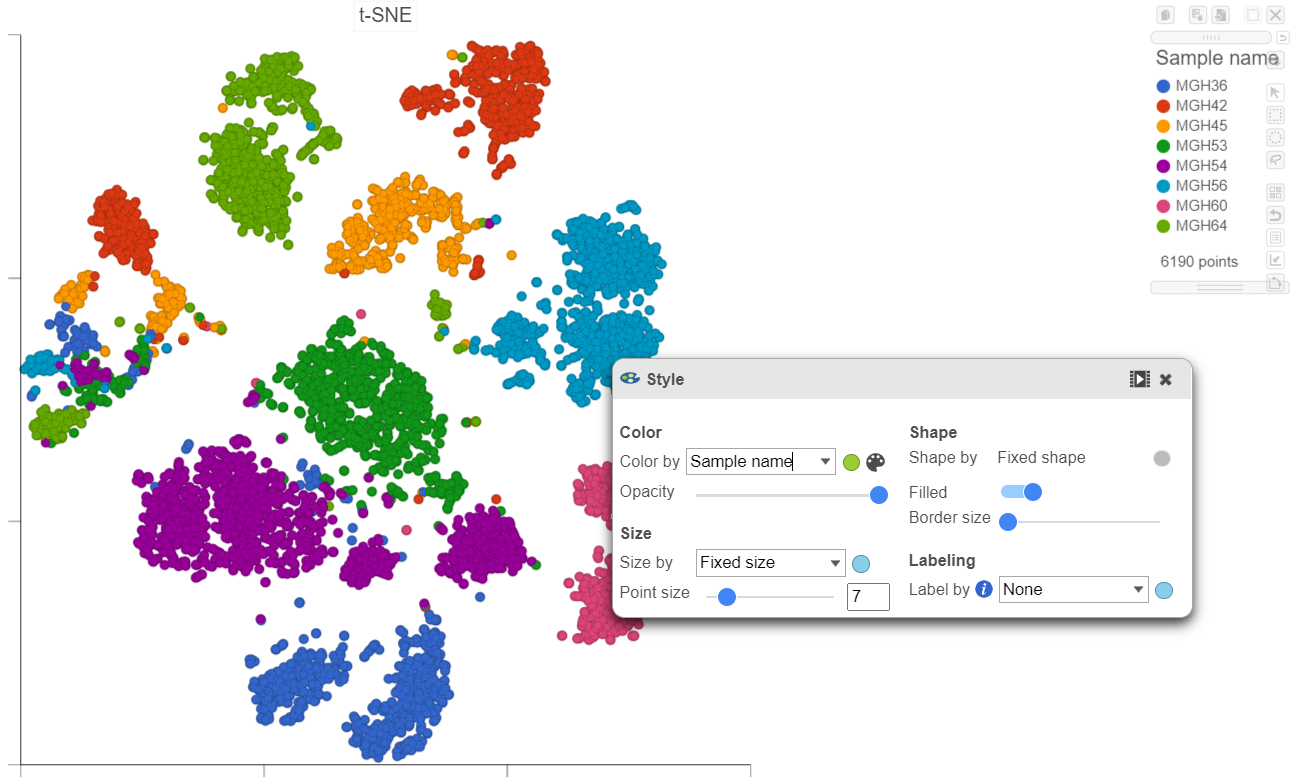
- In the Configuration card, expand the Color card and Style icon, choose Sample name from the Color by drop-down list under Color
Viewing the 2D t-SNE plot, while most cells cluster by sample, there are a few clusters with cells from multiple samples (Figure 26).
...
| Numbered figure captions | ||||
|---|---|---|---|---|
| ||||
|
Using marker genes, BCAN (glioma), CD14 (microglia), and MAG (oligodendrocytes), we can assess whether these multi-sample clusters belong to our known cell types.
...
- Switch to lasso mode by clicking the
 icon in the top right of the plot
 - Draw the lasso around the cluster of red cells and click the circle to close the lasso (Figure 28)
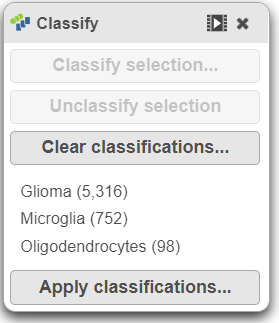
- Click Classify Open the Classify tool and click Classify selection
- Name the classification Microglia
- Click Save
...
- Switch to pointer mode by clicking
 in the top right corner of the plot
 - Deselect the cells by clicking on any blank space on the plot
- Switch to lasso mode again by clicking the icon in the top right of the plot
- Draw the lasso around the cluster of blue cells and click the circle to close the lasso
- Click Classify Open the Classify tool and click Classify selection
- Name the classification Oligodendrocytes
- Click Save
...
- Switch to pointer mode by clicking in the top right corner of the plot
- Deselect the cells by clicking on any blank space on the plot
- Switch to lasso mode again by clicking the icon in the top right of the plot
- Draw the lasso around the cluster of green cells and click the circle to close the lasso
- Click Classify Open the Classify tool and click Classify selection
- Name the classification Glioma
- Click Save
- Switch to pointer mode by clicking in the top right corner of the plot
- Deselect the cells by clicking on any blank space on the plot
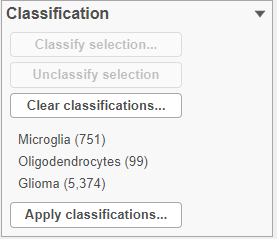
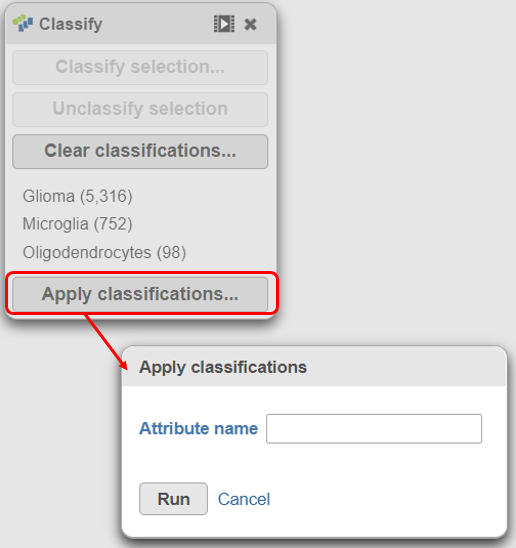
The number of cells classified as microglia, oligodendrocytes, and glioma are shown in the Classification card on the right Classify (Figure 29)
| Numbered figure captions | ||||
|---|---|---|---|---|
| ||||
|
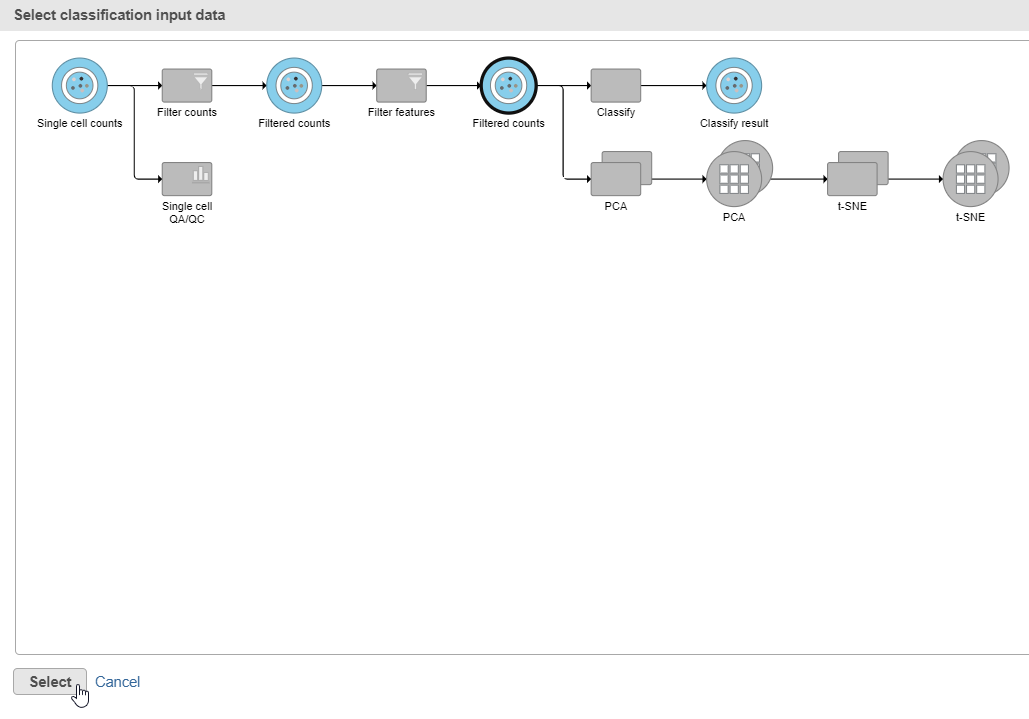
- Click Apply classifications in the Classification card on the rightClick the Filtered counts data node as input data for the classification task the Classify icon (Figure 30)
- Click Select
| Numbered figure captions | ||||
|---|---|---|---|---|
| ||||
|
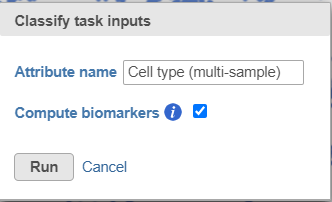
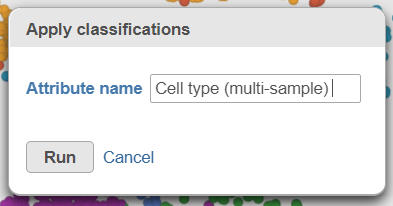
- Name the classification attribute Cell type (multi-sample) (Figure 31)
- Click Run
- Click OK on the information box that says a classification task has been enqueued
| Numbered figure captions | ||||
|---|---|---|---|---|
| ||||
|
A new task, Classify, is added to the Analyses tab. This task produces a new Classify result data node in a green layer (Figure 32).
...
Overview
Content Tools