Page History
...
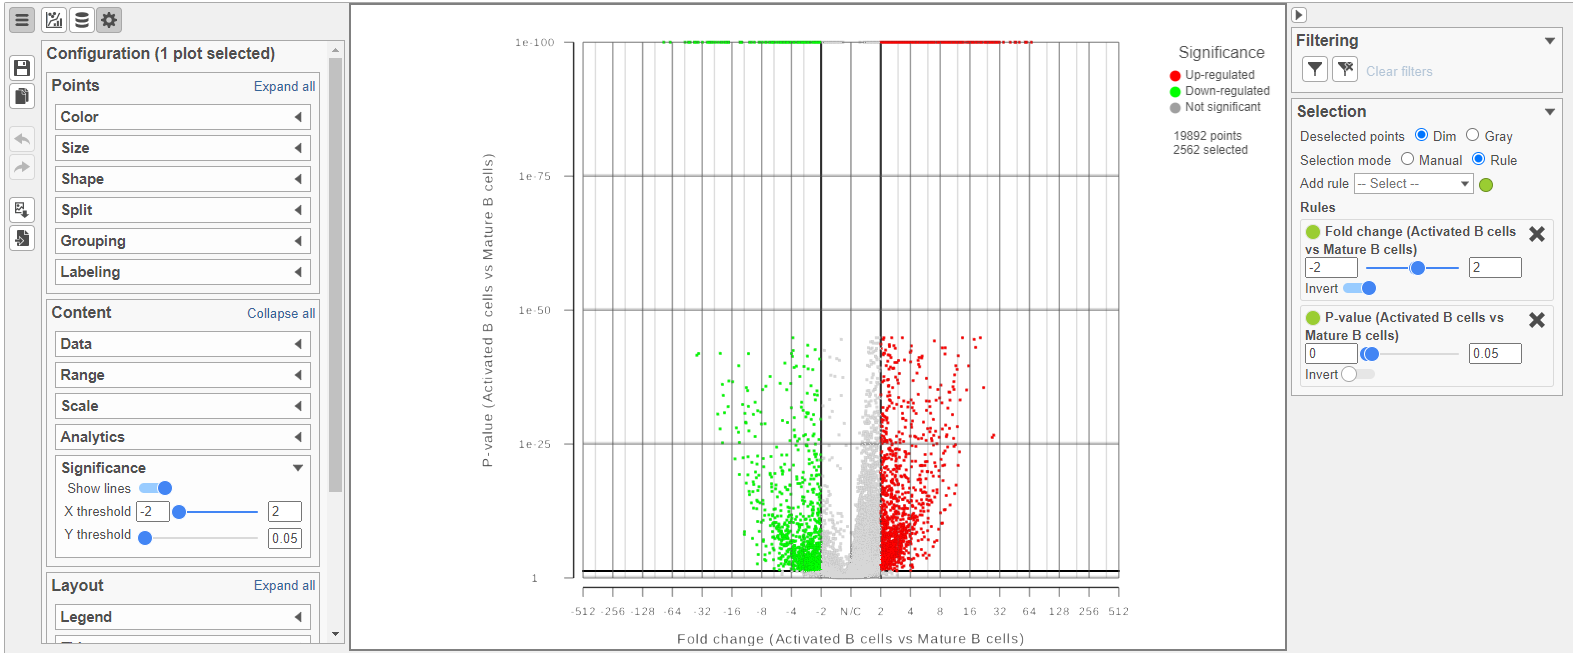
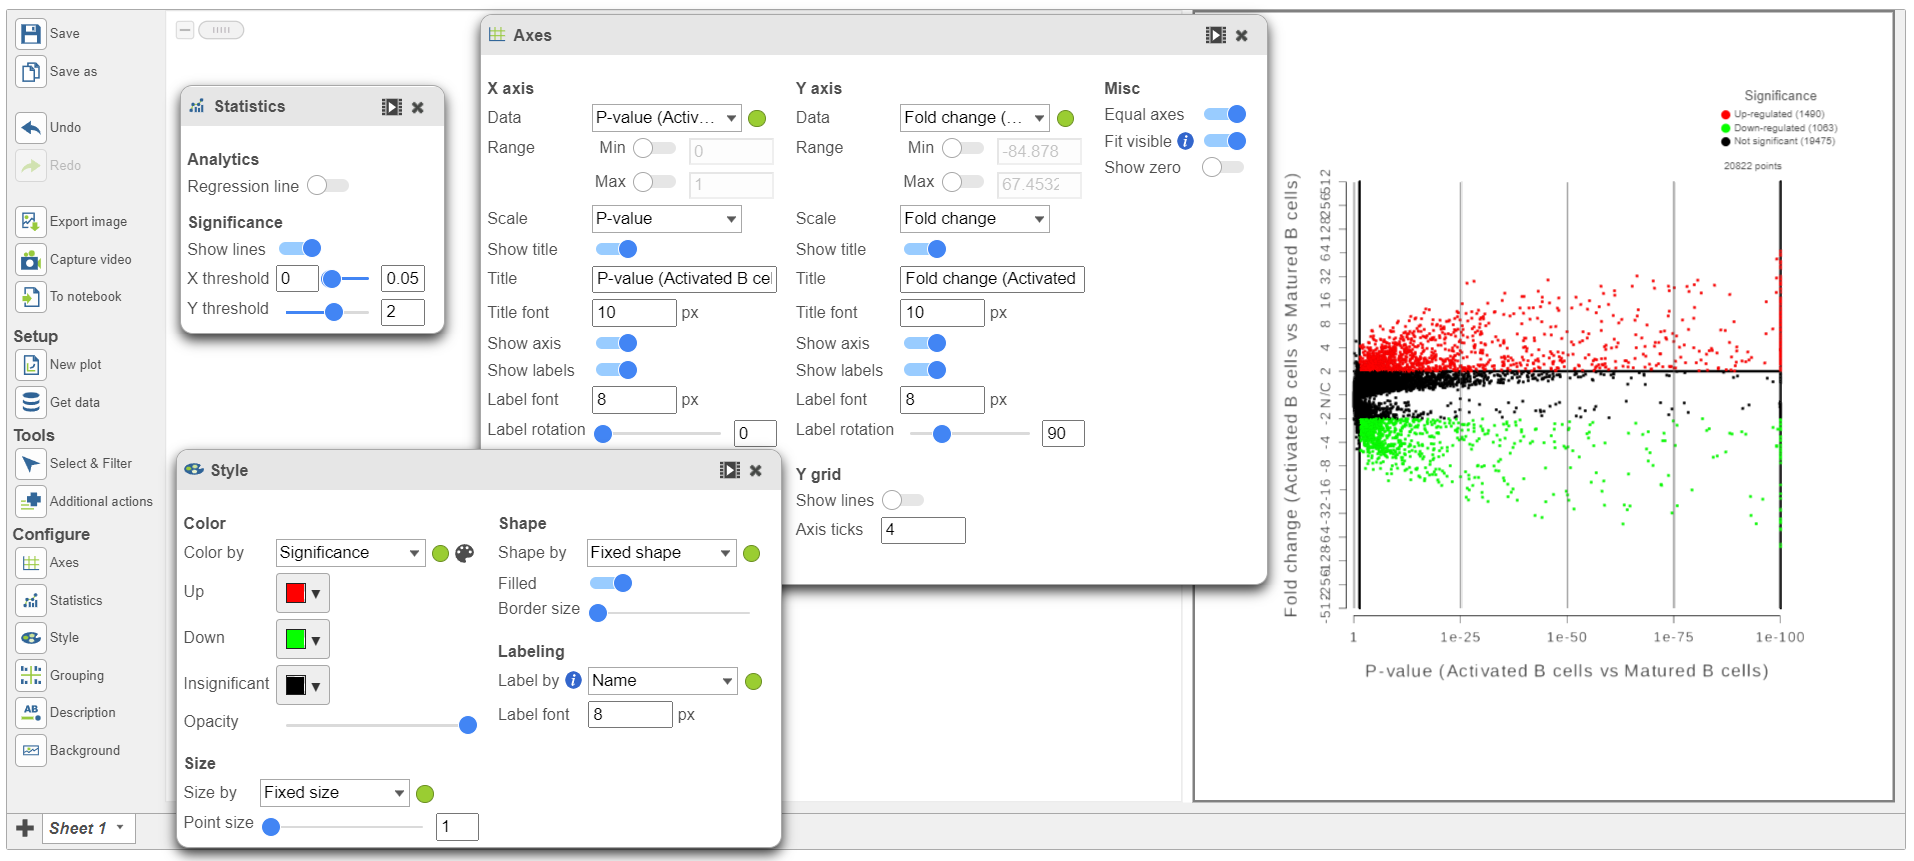
The plot can be configured using various options in the Configuration card on the tools on the left. For example, the Color, Size and Shape cards can the Style icon can be used to change the appearance of the points. The X and Y-axes can be changed in the Data card. The Significance card can the Axes icon. The Statistics icon can be used to set different Fold-change and P-value thresholds for coloring up/down-regulated genes. The in plot controls can be used to transpose ![]() the volcano plot (Figure 14).
the volcano plot (Figure 14).
| Numbered figure captions | ||||
|---|---|---|---|---|
| ||||
|
- Click the GSA report tab in your web browser to return to the full report
...
Overview
Content Tools