Page History
...
The input for Annotate peaks is a Peaks type data node.
- Click a Peaks data node
Click the Peak analysis section in the toolbox
- Click Annotate peaks
- Set the Genomic overlaps parameter
The Genomics overlaps parameter lets you choose one of two options (Figure 1).
- Report one gene region per peak (precedence applies) chooses one gene section for each peak using the precedence order to settle cases where more than one gene section overlaps a peak. The order of precedence is TSS, TTS, CDS Exon, 5' UTR Exon, 3' UTR Exon, Intron, Intergenic.
- Report all gene regions per peak creates a row for each gene section that overlaps a peak in the task report.
| Numbered figure captions | ||||
|---|---|---|---|---|
| ||||
|
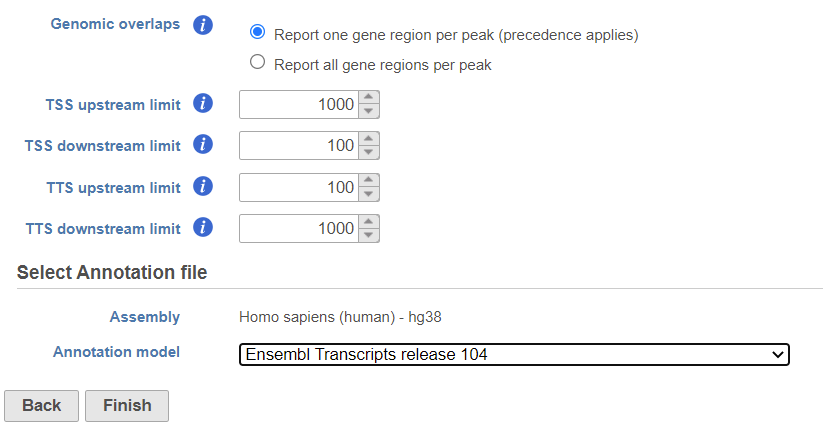
User should define the transcription start site (TSS) and transcription termination site (TTS) limit in the unit of bp
- Choose a gene/feature annotation from the drop-down menu
- Click Finish to run
...
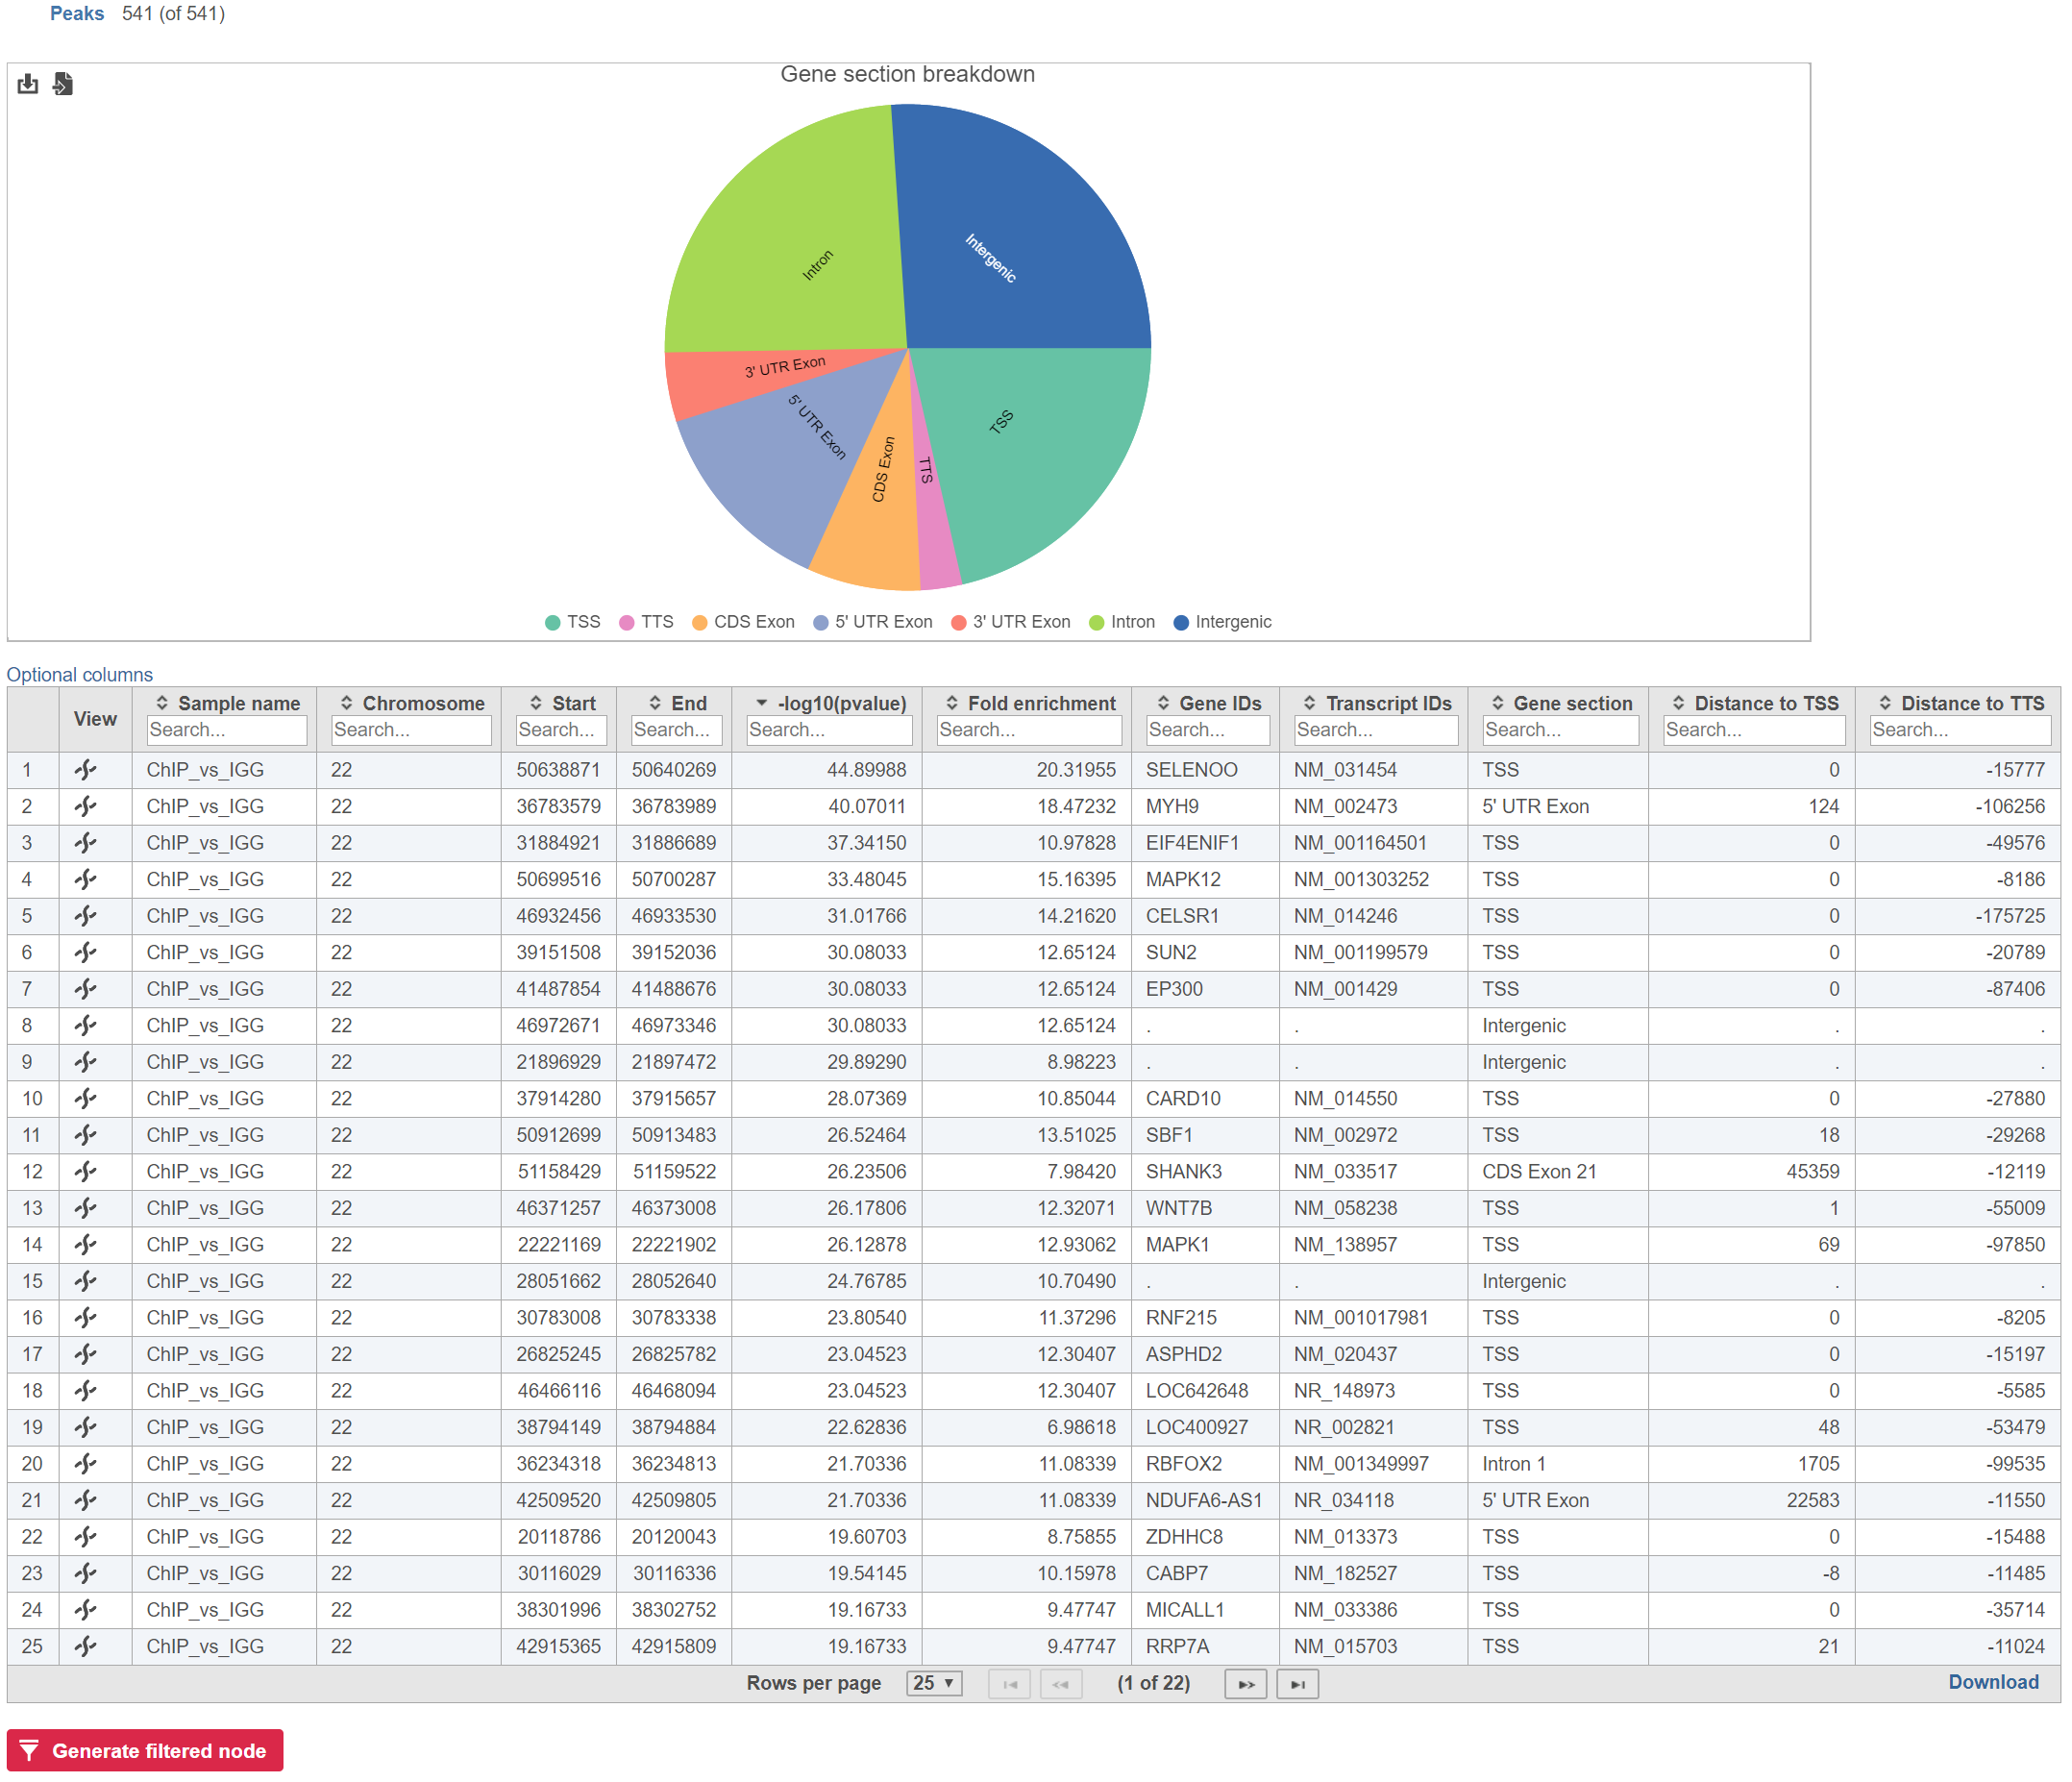
Annotate peaks produces an Annotated peaks data node. The Annotated peaks task report adds a Gene section breakdown pie chart and adds columns with information about the Gene IDs, Transcript IDs, Gene section, Distance to TSS, and Distance to TTS of each peak to the standard Peaks report (Figure 12). If run with the option to report all gene sections selected, each peak will have a row for each gene section it overlaps. If run with the option to report one gene section selected, each peak will have one row with the gene section it overlaps chosen using the order of precedence.
...
| Numbered figure captions | ||||
|---|---|---|---|---|
| ||||
|
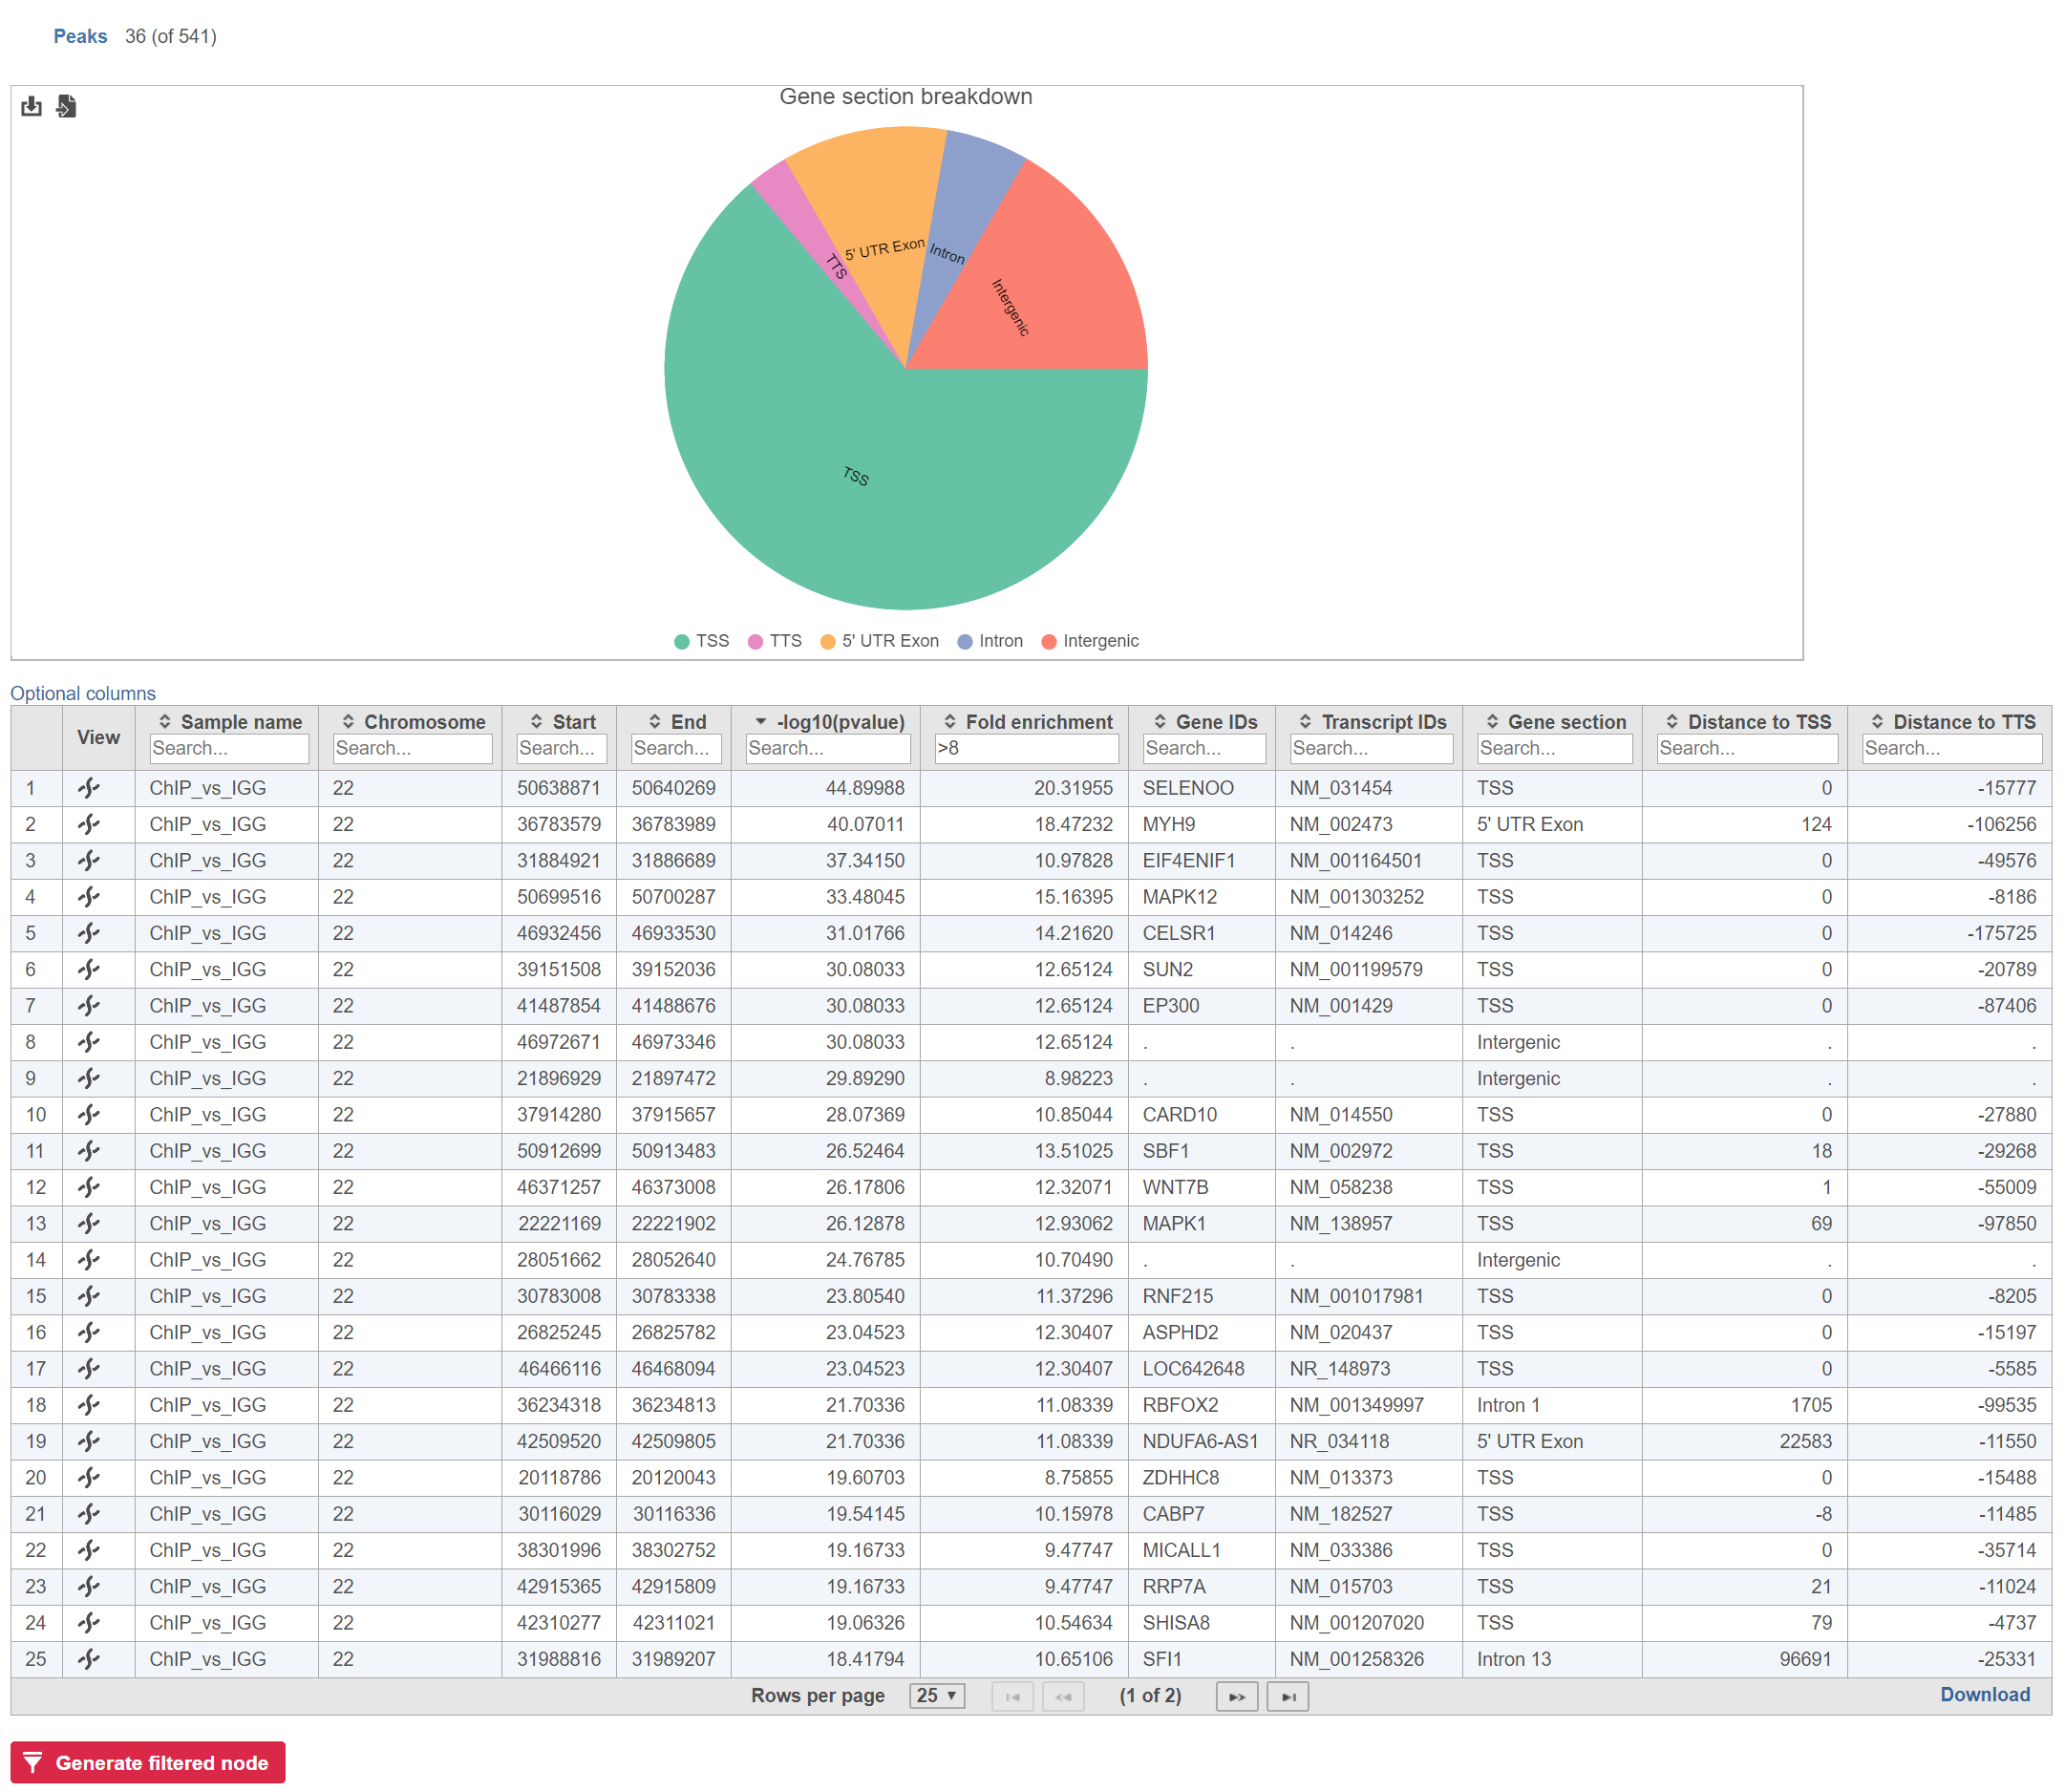
The table can be sorted and filtered by any of its columns (Figure 23). The Gene section breakdown pie chart will update as the table is filtered (the current (Peaks) and the total number of peaks (in parenthesis) are given in the upper left corner). Click on the Optional columns on the upper-left corner of the table to add more information on each region
| Numbered figure captions | ||||
|---|---|---|---|---|
| ||||
|
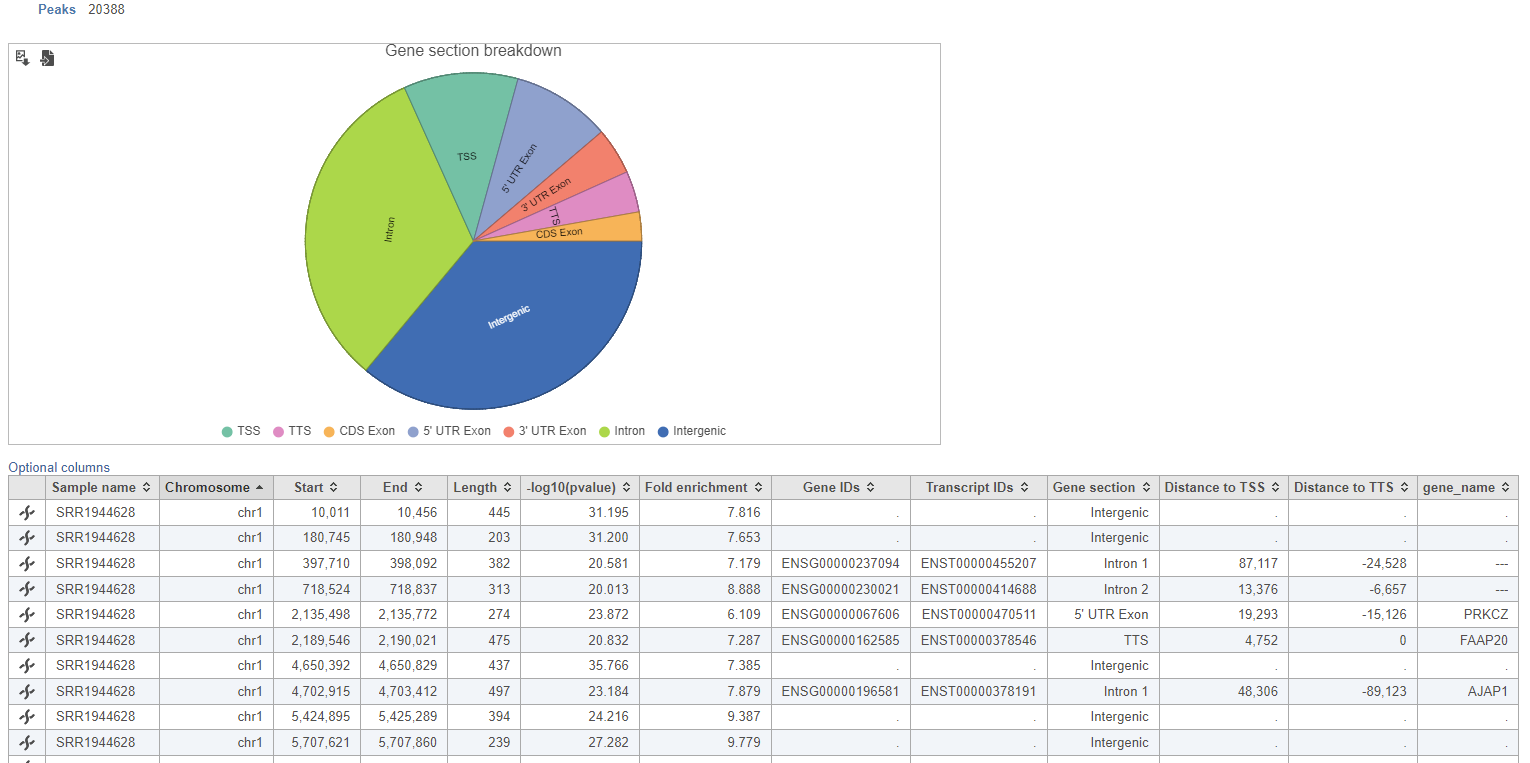
Clicking the  button at the bottom of the task report generates a Filtered peaks data node containing only the peaks currently included in the table.
|
Gene sections
TSS
Transcription start site (TSS) is -1000bp and +100bp (default setting) from the TSS for a transcript
...
Transcription termination site (TTS) is -100bp and +1000bp (default setting) from the TTS for a transcript
...
Intergenic is not located within 1000bp of a transcript
Annotate peaks vs. Annotate regions
Annotate regions is almost identical to Annotate peaks. Annotate regions takes Region counts data as the input and outputs Annotated region counts. One important difference is that you cannot filter the Annotated region counts from the task report.
Run Annotate regions prior to performing differential analysis if you will want to be able to view gene section information and filter regions by gene section in the differential analysis task report.
| Rate Macro |
|---|
Overview
Content Tools