Page History
...
In survival analysis, the event should be well-defined with two levels and occur at a specific time. Because the primary outcome of the event is typically unfavorable (e.g., death, metastasis, relapse, etc.), the event is called a “hazard.” The hazard ratio is used to assess the likelihood of the event occurring while controlling for other co-predictors (co-variables/co-factors) if added to the model. In other words the hazard ratio is how rapidly an event is experienced and is a comparison of by comparing the hazard between groups. A hazard ratio greater than 1 indicates a shorter time-to-event, a hazard ratio less than 1 is associated with a greater time-to-event, and a hazard ratio of 1 indicates no effect on time-to-event. For example, if the hazard ratio is 2 then there is twice a chance of occurrence compared to the other group. More information on hazard ratios.
An important aspect of survival analysis is “censored” data. Censored data refers to subjects that have not experienced the event being studied. For example, medical studies often focus on survival of patients after treatment so the survival times are recorded during the study period. At the end of the study period, some patients are dead, some patients are alive, and the status of some patients is unknown because they dropped out of the study. Censored data refers to the latter two groups. The patients who survived until the end of the study or those who dropped out of the study have not experienced the study event "death" and are listed as "censored".
...
- Open the Cox Regression task in the task menu under Statistics Statistics for any counts node.

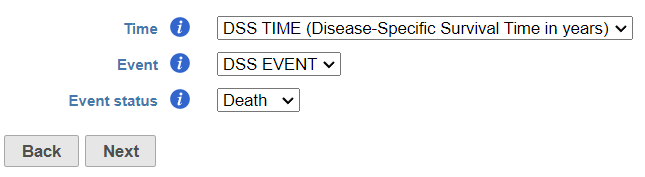
- Next, select the Time, Event, and Event status using the drop-down window. Partek Flow will automatically guess factors that are might be appropriate for these options. Click Next to proceed with the task.

- The predictors (factors or variables) and co-predictors (factors) in the model must be defined. Co-predictors are numeric or categorical factors that will be included in the cox regression model. Time-to-event will be performed on features (e.g. genes) by default . Select unless Use feature expression as predictor is unchecked. If unchecked, select a factor and Add factors that is not features to model a different variable which will disable each feature as a factor. Next, choose the factor of interest from the drop-down menu. Add factors will add factors to . Using the default setting, Use feature expression as predictor, lets the user Add factors to the model that act to explain the relationship for time-to-event (co-factorspredictor) in addition to features. Choose Add interaction to add co-predictors with known dependencies. If factors are added here, they cannot be added as stratification factors. Click Next to proceed with the task.

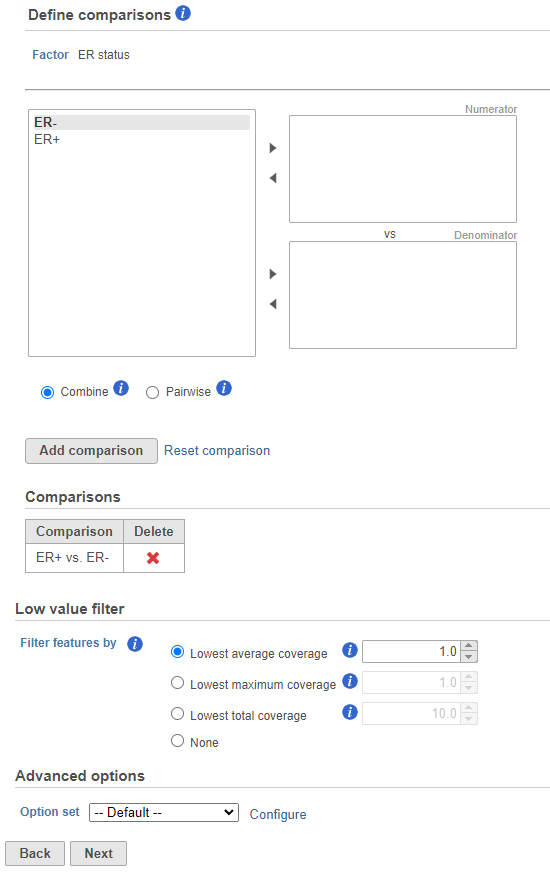
- Next, the user can define comparisons. Configure contrasts by moving factors into the numerator (e.g. experimental factor) or denominator (e.g. control factor / reference), choose Combine or Pairwise, and add the comparison which will be displayed below. Combine all numerator levels and combine all denominator levels in a single comparison or choose Pairwise to split all numerator levels and split all denominator levels into a factorial set of comparisons meaning every numerator will be paired with every denominator. Multiple comparisons from different factors can be added with Add comparison. Low value filter can be used to filter by excluding features; choose a filter or select none.
- Select categorical factors to perform stratification. Stratification is used when proportional hazard assumptions are violated or not constant over time with co-predictors. Stratified Cox regression accounts for non-proportional hazards over time by optimizing hazard strata then fitting the stratified Cox regression model. In other words, the data is split into subgroups based on the categorical variable and the model is re-estimated. This accounts for the effect of a co-predictor that varies over time.

- The results of Cox regression analysis provide key information to interpret, including:
- Hazard ratio (HR): if the HR = 0.5 then half as many patients are experiencing the event compared to the control group, if the HR = 1 the event rates are the same in both groups, and if the HR = 2 then twice as many are experiencing an event compared to the control group.
- HR limit:
- P-value: the lower the p-value, the greater the significance of the observation.
staircase pattern (instead of straight lines connecting each point). Each drop in this staircase represents the occurrence of on (or more) events of interest for this plotted group.
In the left graph below, the elapsed observation time is plotted on the curve as a tick. Symbols for both events and censored observations are plotted, but the ticks for the events are “hidden” by the vertical portions of the curve. Censored observations can be clearly seen as ticks along the horizontal portion of the curve. These data include two observations in the treated group between the times of 100 and 150 days.
| Additional assistance |
|---|
| Rate Macro | ||
|---|---|---|
|
...
Overview
Content Tools