...
| Numbered figure captions |
|---|
| SubtitleText | Comparison of expected number of molecules of ERCC Mix A and the estimated number of transcript molecules (log2 of RPKM values), obtained by Partek’s modification of expectation-maximization algorithm. Each dot is an ERCC control. r^2 = 0.97, regression y = 0.98 * x - 74.41 |
|---|
| AnchorName | comp-expected |
|---|
|
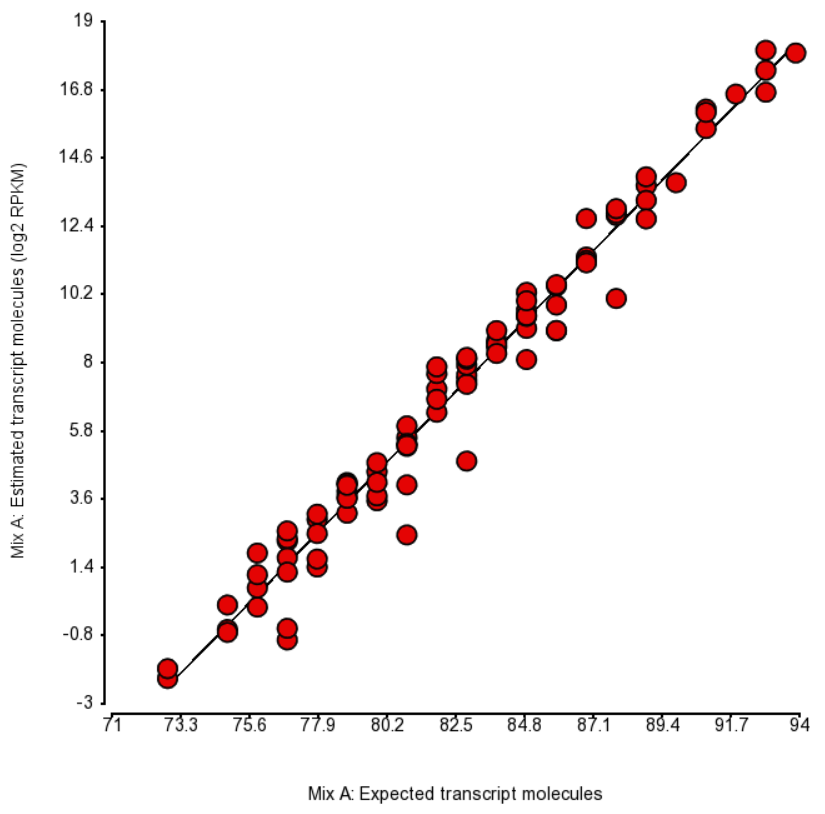 Image Removed Image Removed Image Added Image Added
|
| Numbered figure captions |
|---|
| SubtitleText | Comparison of expected number of molecules of ERCC Mix B and the estimated number of transcript molecules (log2 of RPKM values), obtained by Partek’s modification of expectation-maximization algorithm. Each dot is an ERCC control. r^2 = 0.97, regression y = 0.98 * x - 74.06 |
|---|
| AnchorName | comp-expected2 |
|---|
|
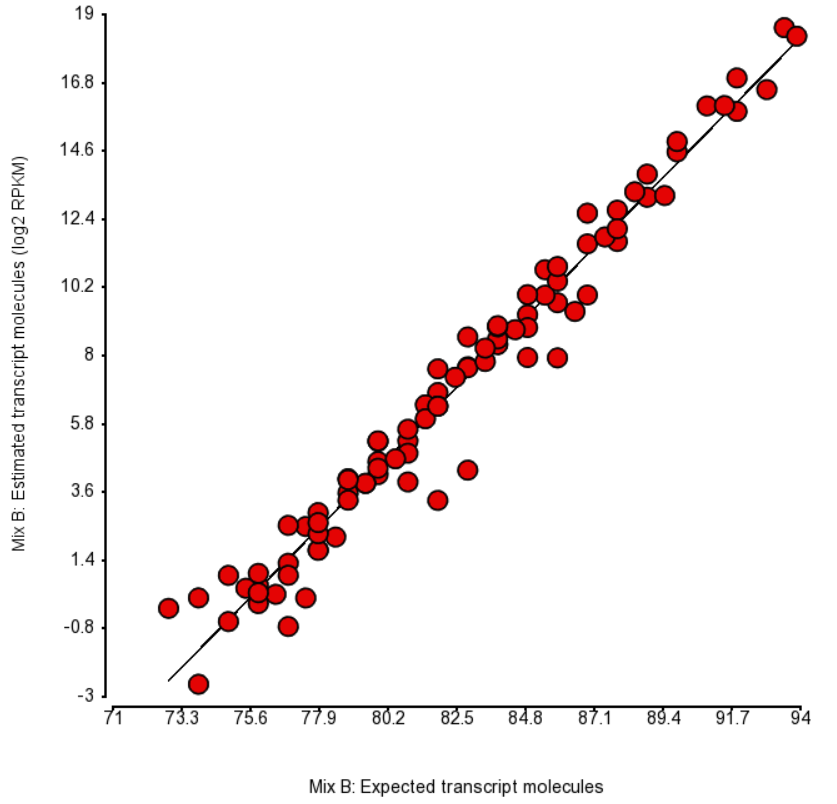 Image RemovedImage Added Image RemovedImage Added
|
| Numbered figure captions |
|---|
| SubtitleText | Comparison of expected fold change (log2) vs. observed fold change (log2) in ERCC Mix A vs. Mix B, for the four groups of transcripts with the known fold change values. Each dot is an ERCC control. r^2 = 0.87, regression y = 0.96 * x + 0.09 |
|---|
| AnchorName | comp-expected3 |
|---|
|
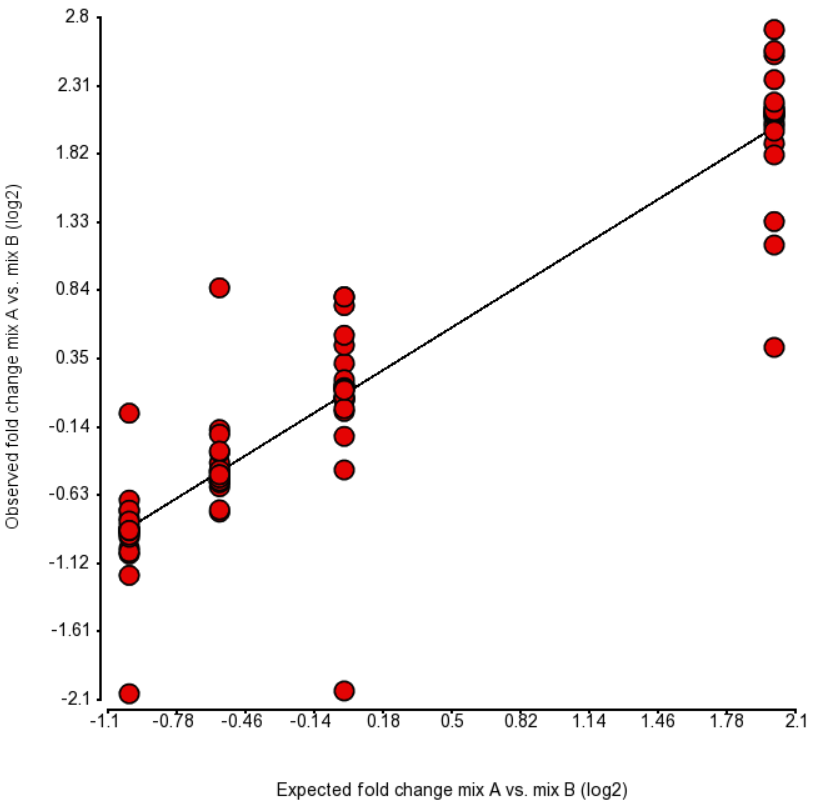 Image RemovedImage Added Image RemovedImage Added
|
To test for possible biases in abundance estimates, we combined the approaches of Li et al. (9) and Jiang et al. (12). That amounted to regressing the estimated abundance not only on the expected abundance, but also on the transcript length, GC content, and the expected fold change, subjecting all the variables to log2 transformation.
...
| Numbered figure captions |
|---|
| Prefix | Table |
|---|
| SubtitleText | Regression of the observed transcript abundance on the expected transcript abundance, transcript length, GC content, and the expected fold change, subjecting all the variables to log2 transformation. We started with the full model containing four covariates and performed model selection based on two criteria: adjusted r^2 (computed for all possible models) and stepwise regression (with a cutoff p-value of 0.15). The assessment was performed on the Mix A of ERCC, using Partek’s modified expectation-maximization (EM) algorithm for transcript quantification. |
|---|
| AnchorName | table1 |
|---|
|
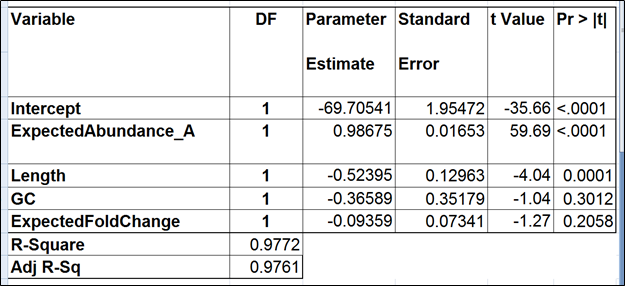 Image RemovedImage Added Image RemovedImage Added
|
| Numbered figure captions |
|---|
| Prefix | Table |
|---|
| SubtitleText | Regression of the observed transcript abundance on the expected transcript abundance and transcript length (the best model). We started with the full model containing four covariates and performed model selection based on two criteria: adjusted r^2 (computed for all possible models) and stepwise regression (with a cutoff p-value of 0.15). The assessment was performed on the Mix A of ERCC, using Partek’s modified expectation-maximization (EM) algorithm for transcript quantification. |
|---|
| AnchorName | table2 |
|---|
|
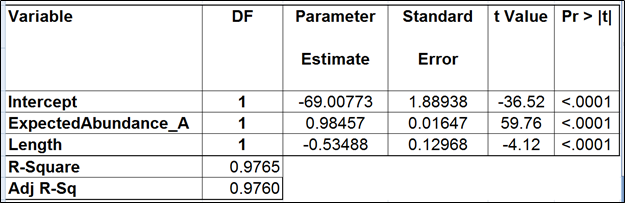 Image RemovedImage Added Image RemovedImage Added
|
| Numbered figure captions |
|---|
| Prefix | Table |
|---|
| SubtitleText | Regression of the observed transcript abundance on the expected transcript abundance (the benchmark model). We started with the full model containing four covariates and performed model selection based on two criteria: adjusted r^2 (computed for all possible models) and stepwise regression (with a cutoff p-value of 0.15). The assessment was performed on the Mix A of ERCC, using Partek’s modified expectation-maximization (EM) algorithm for transcript quantification. |
|---|
| AnchorName | table3 |
|---|
|
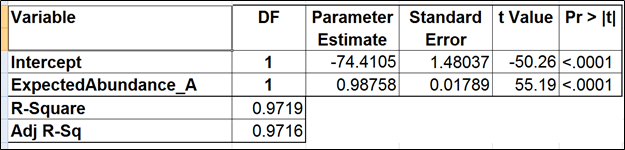 Image RemovedImage Added Image RemovedImage Added
|
The full and the best models for the Mix B are shown in Tables 4 and 5 (respectively). Apparently, the regression failed to find evidence of any kind of bias.
| Numbered figure captions |
|---|
| Prefix | Table |
|---|
| SubtitleText | Regression of the observed transcript abundance on the expected transcript abundance, transcript length, GC content, and the expected fold change, subjecting all the variables to log2 transformation. We started with the full model containing four covariates and performed model selection based on two criteria: adjusted r^2 (computed for all possible models) and stepwise regression (with a cutoff p-value of 0.15). The assessment was performed on the Mix B of ERCC, using Partek’s modified expectation-maximization (EM) algorithm for transcript quantification. |
|---|
| AnchorName | table4 |
|---|
|
Image Modified |
| Numbered figure captions |
|---|
| Prefix | Table |
|---|
| SubtitleText | Regression of the observed transcript abundance on the expected transcript abundance (the best model). We started with the full model containing four covariates and performed model selection based on two criteria: adjusted R2 (computed for all possible models) and stepwise regression (with a cutoff p-value of 0.15). The assessment was performed on the Mix A of ERCC, using Partek’s modified expectation-maximization (EM) algorithm for transcript quantification. |
|---|
| AnchorName | table5 |
|---|
|
|
...