...
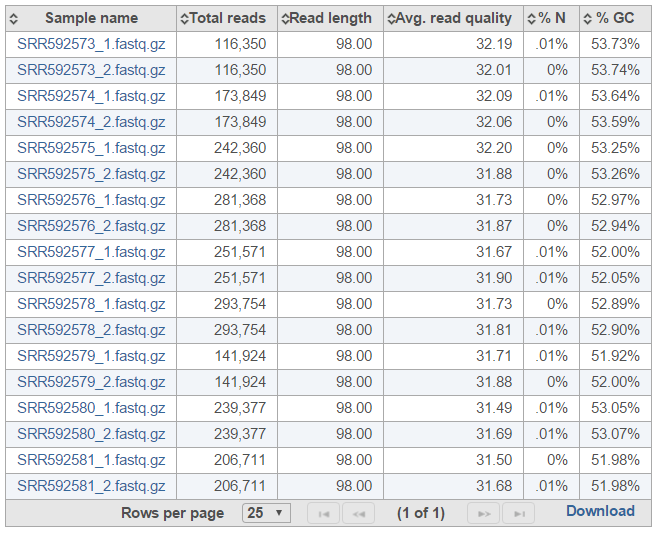
The Pre-alignment QA/QC output table contains one input file per row, with typical metrics on columns (%GC: fraction of GC content; %N: fraction of no-calls) (Figure 3). The file names are hyperlinks, leading to the sample-level reports. To save the table as a txt file to a local computer, push the Download link. Table columns can be sorted using double arrows icon ( Image Modified).
| Numbered figure captions |
|---|
| SubtitleText | Pre-alignment QA/QC output table (project-level). Each row is an input file. %N: proportion of no-calls, %GC: GC content |
|---|
| AnchorName | result-table |
|---|
|
|
Two project-level plots are
Average base quality per position and
Average base quality score per read (Figure 4). The latter plot presents the proportion of reads (y-axis) with certain average quality score (meaning all the base qualities within a read are averaged; x-axis). Mouse over a data point to get the matching readouts. The
Save icon saves the plot in a .svg format to the local machine. Each line on the plot represents a data file and you can select the
sample names from the legend to hide/un-hide individual lines.
...