Page History
...
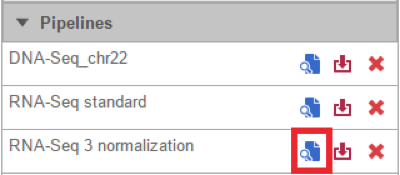
- Click on a circular data node under the Analyses tab and expand the Pipelines section from the menu on the right. The context-sensitive menu will only display pipelines that can be applied to the data type of the selected data node
- Click the Preview pipeline (
) icon next to the name of the pipeline you want to preview (Figure 1)
| Numbered figure captions | ||||
|---|---|---|---|---|
| ||||
|
...
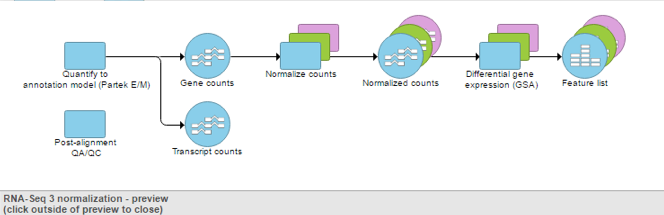
- . An image of the pipeline will be displayed at the centre of the screen (Figure
...
- 2). To close the image and return to
...
- the Analyses
...
- tab, click outside of the image.
| Numbered figure captions | ||||
|---|---|---|---|---|
| ||||
|
| Numbered figure captions | ||||
|---|---|---|---|---|
| ||||
|
| Additional assistance |
|---|
|
| Rate Macro | ||
|---|---|---|
|
Overview
Content Tools