...
| Numbered figure captions |
|---|
| SubtitleText | Invoking a volcano plot from a Feature list data node |
|---|
| AnchorName | invoke-volcano-plot |
|---|
|
 Image Removed Image Removed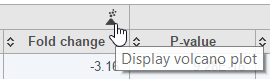 Image Added Image Added
|
Each point on the plot represents the statistical result for a single gene, transcript or feature. The color of the point reflects fold change: genes with a fold change above 2 (up-regulated) are in green, genes with a fold change below -2 (down-regulated) are in red. The remaining genes are in grey (Figure 2). The plot header is derived from the name of the contrast.
...
| Numbered figure captions |
|---|
| SubtitleText | Volcano plot: each dot on the plot is a single gene/transcript/feature. Horizontal axis: fold change (in log2 scale); vertical axis: p-value (in log10 scale). Colour coding is based on the fold change. Thick vertical lines highlight fold changes of -2 and +2, while a thick horizontal line represents a p-value of 0.05 |
|---|
| AnchorName | volcano-plot |
|---|
|
 Image Removed Image Removed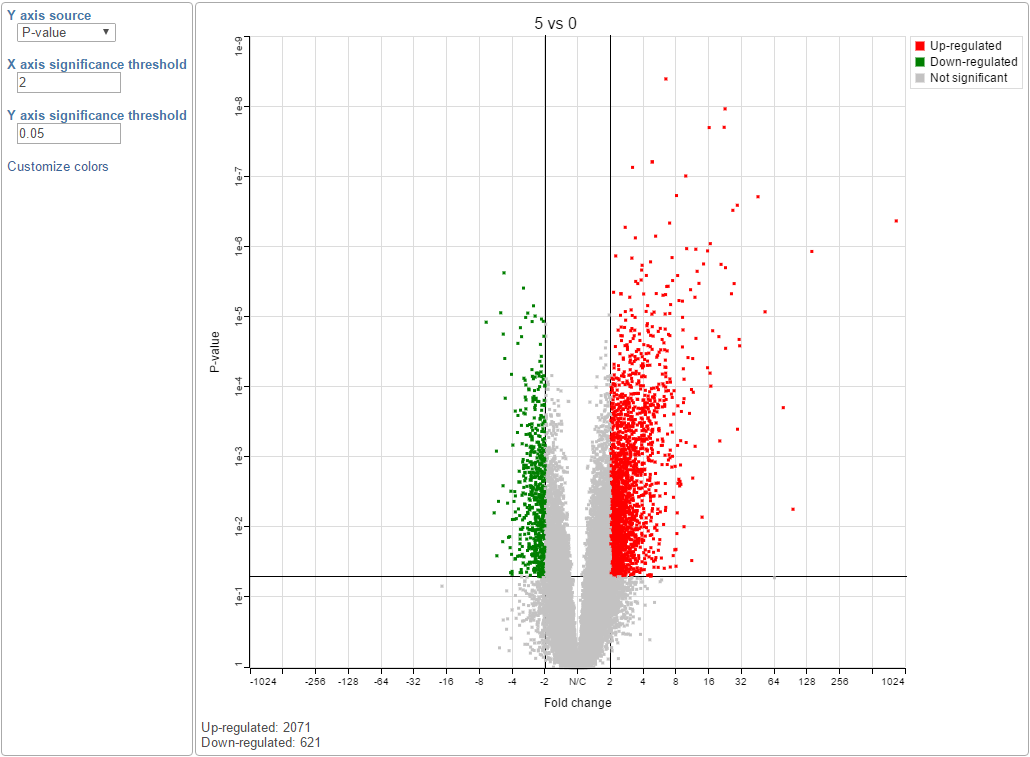 Image Added Image Added
|