...
| Numbered figure captions |
|---|
| SubtitleText | RNA-Seq workflow with principal components analysis (PCA) task invoked on the Gene counts data node |
|---|
| AnchorName | rnaseq-pca |
|---|
|
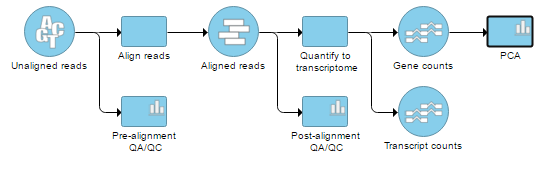 Image Removed Image Removed Image Added Image Added
|
On the other hand, the Cufflinks quantification node is not associated with a detailed report like the Partek E/M nodes, so opening the node by double clicking (or going via the toolbox) brings up the PCA plot directly.
...
| Numbered figure captions |
|---|
| SubtitleText | Principal components analysis plot in 3D. Each dot is a sample and samples originating from the same biological source (dependent study design) are connected by lines. The axes show the first three principal components, with the fraction of explained variance in the parenthesis |
|---|
| AnchorName | pca-3d |
|---|
|
Image Modified |
If you want to change a color, select the Customize colors hyperlink. The resulting dialog (Figure 5) will enable you to replace an existing color by a color of your choice (click on the arrow head

to invoke the color mixer) or add more colors (Add color).
...
| Numbered figure captions |
|---|
| SubtitleText | Principal components analysis plot in 2D. Each dot is a sample. The axes show the first two principal components, with the fraction of explained variance in the parenthesis (an example) |
|---|
| AnchorName | pca-2d |
|---|
|
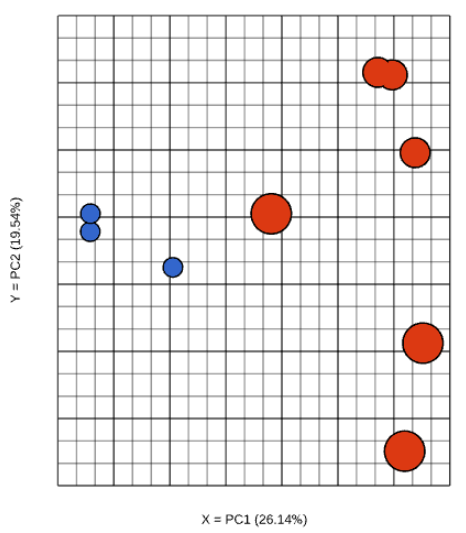 Image RemovedImage Added Image RemovedImage Added
|
Although first three PCs are shown by default, you can plot any of the first nine PCs, by using the X, Y, and Z drop-down lists.
...