...
| Numbered figure captions |
|---|
| SubtitleText | RNA-Seq workflow with principal components analysis (PCA) task invoked on the Gene counts data node |
|---|
| AnchorName | rnaseq-pca |
|---|
|
 Image Removed Image Removed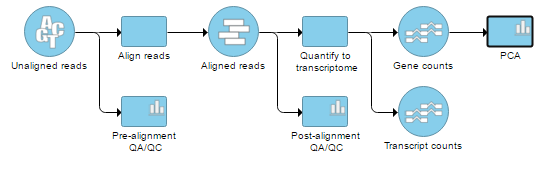 Image Added Image Added
|
On the other hand, the Cufflinks quantification node is not associated with a detailed report like the Partek E/M nodes, so opening the node by double clicking (or going via the toolbox) brings up the PCA plot directly.
...
| Numbered figure captions |
|---|
| SubtitleText | Customize colors dialog (default appearance). General tab (palette) is used for sample coloring and general sample attribute-based coloring in the chromosome view, hierarchical clustering, and general charts and graphs. Two-color numeric tab (palette) is used to color by numeric sample attribute in the hierarchical clustering, principal components analysis, and dot plot views. Save button saves your color preferences |
|---|
| AnchorName | custom-colors |
|---|
|
Image Modified |
When
click on a dot (sample), it will be selected and a label of the sample will be displayed, from the
Label by drop-down list to select how to label the selected sample. To select more than one samples, press
Ctrl & click.
...
| Numbered figure captions |
|---|
| SubtitleText | Principal components analysis plot in 2D. Each dot is a sample. The axes show the first two principal components, with the fraction of explained variance in the parenthesis (an example) |
|---|
| AnchorName | pca-2d |
|---|
|
Image Removed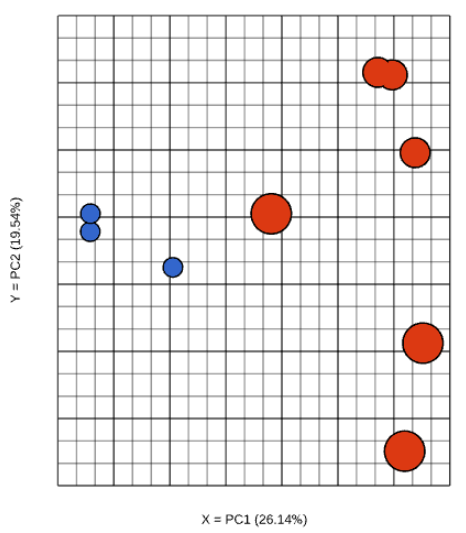 Image Added Image Added |
Although first three PCs are shown by default, you can plot any of the first nine PCs, by using the X, Y, and Z drop-down lists.
...